HelpDesk
How to Create a Directional Map Using ConceptDraw PRO

Cross-Functional Flowchart (Swim Lanes)

Cross-Functional Flowchart


How tо Represent Information Graphically

Tools to Create Your Own Infographics

Building Drawing Software for Design Site Plan


Types of Map - Overview
Business diagrams & Org Charts with ConceptDraw PRO


Superb Examples of Infographic Maps

How to Create a Powerful Infographic When You do not Have a Designer

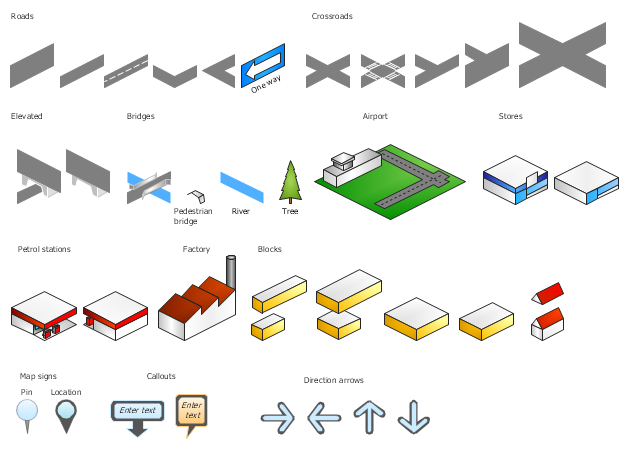
The vector stencils library "3D directional maps" contains 40 symbols for creating pictorial maps, street maps, locator maps, transit maps, tourist maps with points of interest (POI), road maps and route maps using the ConceptDraw PRO diagramming and vector drawing software.
"Pictorial maps are a category of maps that are also loosely called illustrated maps, panoramic maps, perspective maps, bird’s-eye view maps and Geopictorial maps amongst others. In contrast to the regular road map, Atlas or topographic cartography, pictorial maps depict a given territory with a more artistic rather than technical style. The cartography can be a sophisticated 3-D perspective landscape or a simple map graphic enlivened with illustrations of buildings, people and animals. They can feature all sorts of varied topics like historical events, legendary figures or local agricultural products and cover anything from an entire continent to a college campus. ...
Pictorial maps usually show an area as if viewed from above at an oblique angle. They are not generally drawn to scale in order to show street patterns, individual buildings, and major landscape features in perspective. While regular maps focus on the accurate rendition of distances, pictorial maps enhance landmarks and often incorporate a complex interplay of different scales into one image in order to give the viewer a more familiar sense of recognition." [Pictorial maps. Wikipedia]
The design elements library "3D directional maps" is included in the Directional Maps solution from the Maps area of ConceptDraw Solution Park.
3D pictorial map symbols
This SWOT matrix diagram example was created on the base of article "An Easy Way To Jumpstart Your Strategic Plan: SWOT" by Leslie Wolf from the website of the California Digital Library, the University of California. "Strategic planning doesn’t have to be a daunting and lengthy process. The goal is really a simple one: to help you understand your world and build a road map to guide your efforts. ...
This analysis tool can help you focus your attention on the specific success factors that are right for your team.
The tool is called a SWOT analysis. SWOT stands for Strengths and Weaknesses, Opportunities and Threats. Here’s what it means:
(1) Strengths are those positive internal attributes that strengthen your business or team. You can develop plans to capitalize on those strengths.
(2) Weaknesses are those negative internal attributes that are working against your success. You can shore up those weaknesses so they don’t stop your success.
(3) Opportunities are those external conditions that can have a positive effect on your goals. These opportunities can point you in the right direction.
(4) Threats are those external conditions that can have a negative effect on your goals. These threats will affect you less if you can identify and minimize them. ...
We thought it would be helpful to show you a sample SWOT analysis for a business you can easily visualize: a small independent bookstore in a university town. The store owner brought the team together to think about how the bookstore could survive during the continuing financial downturn. After an hour of brainstorming, this is the SWOT analysis they developed." [cdlib.org/ cdlinfo/ 2010/ 09/ 29/ an-easy-way-to-jumpstart-your-strategic-plan-swot/ ]
The matrix diagram example "SWOT analysis for a small independent bookstore" was created using the ConceptDraw PRO diagramming and vector drawing software extended with the SWOT Analysis solution from the Management area of ConceptDraw Solution Park.
SWOT matrix

The vector stencils library "Transport map" contains 96 pictograms for drawing transport maps.
Use it in your spatial infographics for visual representation of transport schemes and plans as metro maps in the ConceptDraw PRO diagramming and vector drawing software extended with the Spatial Infographics solution from the area "What is Infographics" of ConceptDraw Solution Park.
Use it in your spatial infographics for visual representation of transport schemes and plans as metro maps in the ConceptDraw PRO diagramming and vector drawing software extended with the Spatial Infographics solution from the area "What is Infographics" of ConceptDraw Solution Park.
Train Railway

Bus Stop

Tramlink

Marina/Ferry Dock

Information Center

Information Center

Airport

Airport

Underground/Subway/Metro

Underground/Subway/Metro

National Rail Train Station

Taxi

Taxi

Parking

Parking

Parking

Parking

Bicycle Parking

Bicycle Parking

Fuel/Gas/Petrol

Fuel/Gas/Petrol

Police

Police

Hospital

Hospital

Wheelchair Access

Wheelchair Access

First Aid

First Aid

Telephone

Telephone

Post Office

Post Office

Landmarks and Museums

Landmarks and Museums

University

University

Shopping/Supermarket

Shopping/Supermarket

Cafe

Cafe

Food and Drinks

Food and Drinks

Man

Woman

Restrooms/Toilets

Restrooms/Toilets

Park

Park

Zoo

Zoo

Hotel

Hotel

Camping

Camping

City

Skyscraper

Building

Ocean

Straight River

Flexible River

Bridge

North Arrow
Viewpoint

Scale

Road line

Road rounded line

Road corner

Road curve 1

Road curve 2

Crossroads

Roundabout

Cloverleaf interchange

Roadway break

Railway line

Railway curve

Railway fork

Standard line with standard station - basic road

Thick line with standard station - basic road

Standard line with rectangular station - basic road

Thick line with rectangular station - basic road

Standard line with standard station - double road

Thick line with standard station - double road

Standard line with rectangular station - double road

Thick line with rectangular station - double road

Standard line with standard station - dotted road

Thick line with standard station - dotted road

Standard line with rectangular station - dotted road

Thick line with rectangular station - dotted road

Interchange Station Vertical

Interchange Station Horizontal

Transfer Station 1

Transfer Station 2

Transfer Station 3

Line Notation

Street direction

Map Infographic Creator

Rail transport - Design elements

- Drawing Simple Road Map Software
- Simple Way To Draw Road Map
- Road Map Drawing Software
- Directional Map Drawing Software
- Software To Draw Plan And Road Map
- 2D Directional map
- Drawing Roads Map Soft
- Maps | Map Directions | 2D Directional map - Template | Road Maps
- How to Create a Directional Map Using ConceptDraw PRO | Simple ...
- Easy Map Drawing
- Simple Road Map
- Roadmap For Drawing And Dirction
- Draw Simple Location Map
- Simple Road Map For Traffic Signs Projects
- A Simple Pictorial Map
- Directional Maps | How to Create a Directional Map Using ...
- Street Map Drawing Software For Mac
- Software Drawing Directional Map
- Simple Drawing Of A Location
- How to draw Metro Map style infographics? Moscow, New York, Los ...