How to Build Cloud Computing Diagram Principal Cloud Manufacturing

 Venn Diagrams
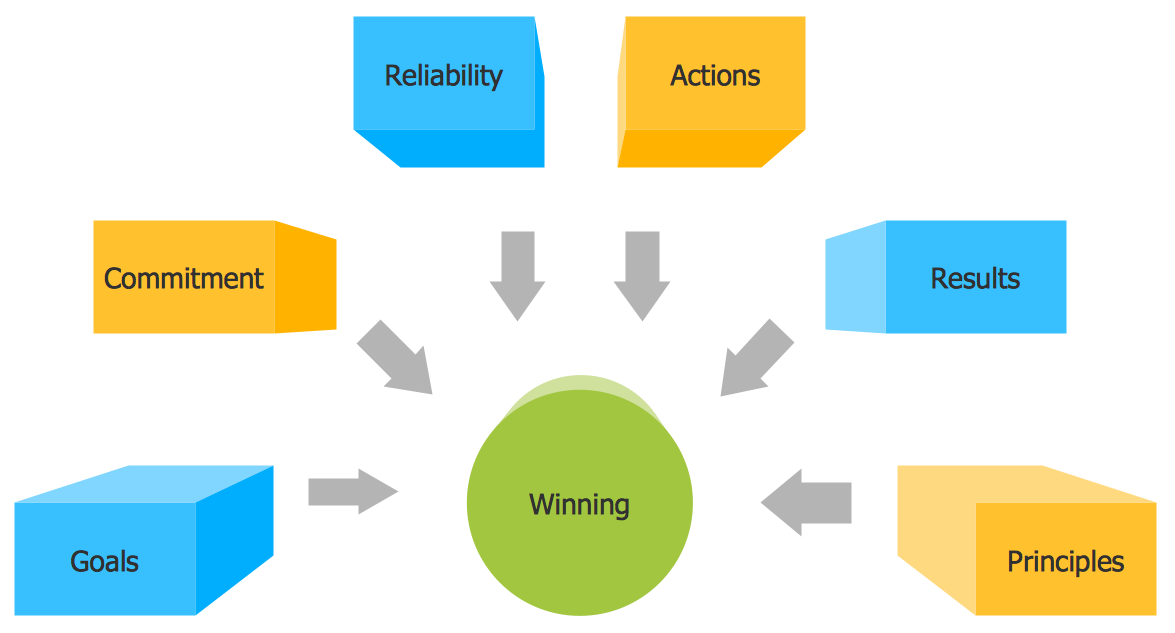
Venn Diagrams are actively used to illustrate simple set relationships in set theory and probability theory, logic and statistics, mathematics and computer science, linguistics, sociology, and marketing. Venn Diagrams are also often used to visually summarize the status and future viability of a project.
 Business Package for Management
Package intended for professional who designing and documenting business processes, preparing business reports, plan projects and manage projects, manage organizational changes, prepare operational instructions, supervising specific department of an organization, workout customer service processes and prepare trainings for customer service personal, carry out a variety of duties to organize business workflow.
Entity-Relationship Diagram (ERD) with ConceptDraw DIAGRAM


 Fishbone Diagrams
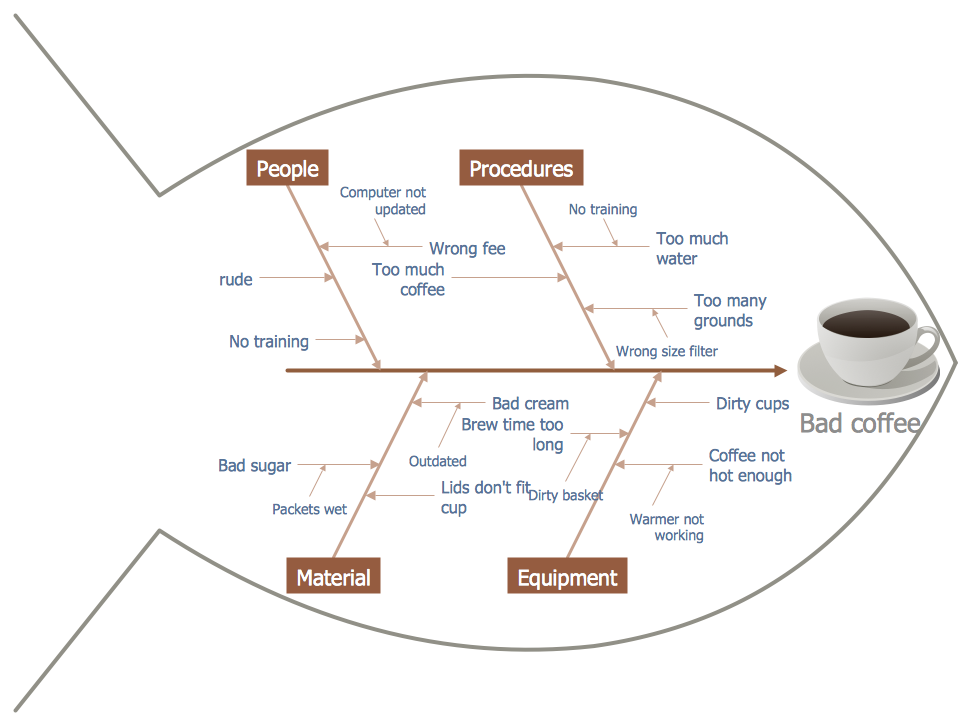
The Fishbone Diagrams solution extends ConceptDraw DIAGRAM software with the ability to easily draw the Fishbone Diagrams (Ishikawa Diagrams) to clearly see the cause and effect analysis and also problem solving. The vector graphic diagrams produced using this solution can be used in whitepapers, presentations, datasheets, posters, and published technical material.
Fishbone Diagram
 Block Diagrams
Block diagrams solution extends ConceptDraw DIAGRAM software with templates, samples and libraries of vector stencils for drawing the block diagrams.
Functional Block Diagram

Block Diagram Creator
Ishikawa Diagram

Fishbone Software Tools for Design Element
_Win_Mac.png)
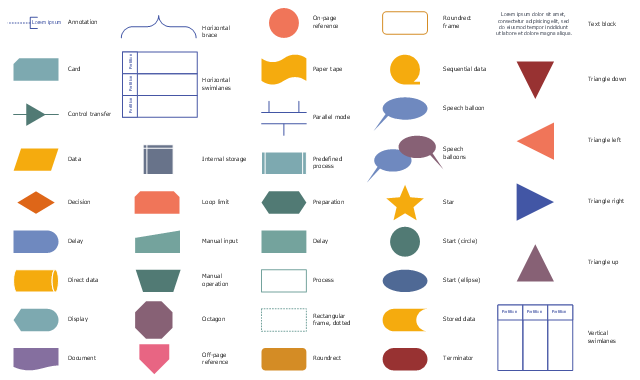
The vector stencils library "Workflow charts" contains 42 flowchart shapes.
Use it to design your business process workflow diagrams with ConceptDraw PRO software.
"Flowcharts are used in designing and documenting simple processes or programs. Like other types of diagrams, they help visualize what is going on and thereby help understand a process, and perhaps also find flaws, bottlenecks, and other less-obvious features within it. There are many different types of flowcharts, and each type has its own repertoire of boxes and notational conventions. ...
Common alternative names include: flowchart, process flowchart, functional flowchart, process map, process chart, functional process chart, business process model, process model, process flow diagram, work flow diagram, business flow diagram." [Flowchart. Wikipedia]
The shapes example "Design elements - Workflow charts" is included in the Business Process Workflow Diagrams solution from the Business Processes area of ConceptDraw Solution Park.
Flowchart shapes
Cause and Effect Diagram

Create Fishbone Diagrams

- Geometrical Triangle Png
- Basic Flowchart Symbols and Meaning | Block Diagram Software ...
- Glyph icons - Vector stencils library | Basic Flowchart Symbols and ...
- Mechanical Engineering | Elements location of a welding symbol ...
- Vector Rectangle Boxes Png
- Basic Flowchart Symbols and Meaning | Dimensioning and ...
- White Circle Png Vector
- Vector Rectangle Png
- Pyramid Diagram | Simple Baseball Field – Sample | Diagramming ...
- Table Png Top View
- Indicators Icon Png
- Library Top View Png
- Tables Top View Png
- Mathematics Symbols | Mathematics | Mathematical Diagrams ...
- Design elements - Text blocks | CMP adaptive management cycle ...
- 24 Hours Png
- Design elements - UML use case diagrams
- Basic Flowchart Symbols and Meaning | Data Flow Diagram | HR ...
- Application Of Basic Operation To Pictogram
- How to Draw Geometric Shapes in ConceptDraw PRO ...