Geo Map — United States of America Map
United States is a federal republic consisting of 50 states and a federal district.ConceptDraw is idea to draw the geological map of the United States of America from the pre-designed vector geo map shapes.
Each map is scaled, with the option to add further levels of detail - county borders, their names, capitals and major cities can be shown or hidden using the action menu for each state map. ConceptDraw PRO gives you full control over map size, shading, color fills and alignment.
Use the Continent Maps solution for easy drawing professional looking geological maps, thematic maps, geospatial infographics and vector illustrations for your business documents, presentations and websites.
USA Map
Usually designing of maps, including the USA Map is a quite complex, long and labour-intensive process. But now we have an excellent possibility to make it easier with ConceptDraw PRO diagramming and vector drawing software extended with powerful USA Maps Solution from the Maps Area of ConceptDraw Solution Park.Basic Flowchart Symbols and Meaning
Flowchart Symbols and Meaning - Provides a visual representation of basic flowchart symbols and their proposed use in professional workflow diagram, standard process flow diagram and communicating the structure of a well-developed web site, as well as their correlation in developing on-line instructional projects. See flowchart's symbols by specifics of process flow diagram symbols and workflow diagram symbols.
USA Maps
Use the USA Maps solution to create a map of USA, a US interstate map, printable US maps, US maps with cities and US maps with capitals. Create a complete USA states map.
How to show a mind map presentation via Skype
Video tutorials on ConceptDraw products. Try it today!
Continent Maps
Continent Maps solution extends ConceptDraw PRO software with templates, samples and libraries of vector stencils for drawing the thematic maps of continents, state maps of USA and Australia.
HelpDesk
How to Draw a Map of USA States Using ConceptDraw PRO
You can found a huge set of geopolitical statistical data regarding America. A common way of visualizing this data is to create maps that connect a particular data in relation to a specific geographical area. Thematic maps are used to depict such data as population density, average rainfall, or political allegiance, representing the data by using visual elements and annotation. Thematic maps always focus on one particular subject matter unlike general reference maps, which display information on a different subjects — vegetation, topology, roads and highways, etc.The United States Mapping Solution for ConceptDraw PRO includes all of the US States with county outlined borders, from the largest, San Bernardino in California, to the smallest Kalawao County, Hawaii.
Geo Map - USA - New York
New York is a state in the Northeastern and Mid-Atlantic regions of the United States.The vector stencils library New York contains contours for ConceptDraw PRO diagramming and vector drawing software. This library is contained in the Continent Maps solution from Maps area of ConceptDraw Solution Park.
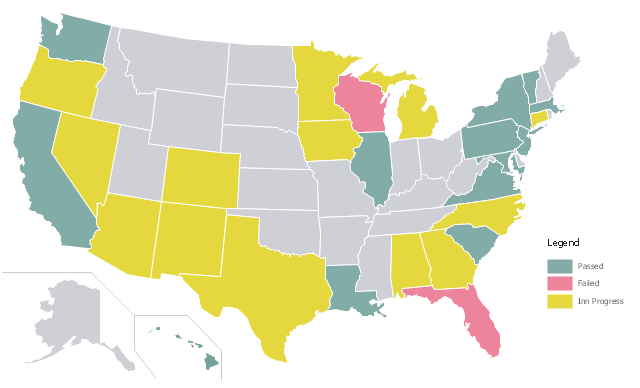
A color-coded map showing US state-by-state status of Benefit Corporation legislation.
"A thematic map is a type of map or chart especially designed to show a particular theme connected with a specific geographic area. These maps "can portray physical, social, political, cultural, economic, sociological, agricultural, or any other aspects of a city, state, region, nation, or continent"." [Thematic map. Wikipedia]
This U.S.A. thematic map was redesigned from Wikipedia file: Benefit Corporation Map 2012 05 16.svg. [commons.wikimedia.org/ wiki/ File:Benefit_ Corporation_ Map_ 2012_ 05_ 16.svg]
This file is licensed under the Creative Commons Attribution-Share Alike 3.0 Unported license.
[creativecommons.org/ licenses/ by-sa/ 3.0/ deed.en]
This U.S. thematic map example was created using the ConceptDraw PRO diagramming and vector drawing software extended with the Continent Maps solution from the Maps area of ConceptDraw Solution Park.
Geo Map - Africa - Congo DRC
The Democratic Republic of the Congo, sometimes referred to as DR Congo, Congo-Kinshasa, DROC, or RDC, is a country located in the African Great Lakes region of Central Africa.The vector stencils library Congo DRC contains contours for ConceptDraw PRO diagramming and vector drawing software. This library is contained in the Continent Maps solution from Maps area of ConceptDraw Solution Park.
HelpDesk
How to Show the Relationship Between Topics
Any mind map contains topics that are arranged in a radial structure. It depicts the relation (semantic, causal, association, etc.) between the concepts, parts, and components of the main idea. In addition to the main connections that make the structure of a mind map, topics can be linked with other lines. ConceptDraw MINDMAP allows you to show the relationships between topics, which belong to different parts of the mind map structure, but also influence each other. Relationships help to show and organize complex interconnections between topics of mind map visually. Such communication is also very important - the mind map, where many topics are not related, tends to turn into a common text.HelpDesk
How to Show a Presentation via Skype
Present and view content from ConceptDraw MINDMAP using a Skype connection.Cross-Functional Flowchart
Cross-Functional Flowchart - to draw cross functional process maps is by starting with a cross-functional flowchart samples and templates. Easy to draw sample cross functional Process Flow Diagrams. Using a Cross-Functional flowchart is a clear way of showing each team member’s responsibilities and how processes get shared or transferred between different teams and departments.Use cross-functional flowcharts to show the relationship between a business process and the functional units (such as departments) responsible for that process. To create it use the best flowchart maker of ConceptDraw PRO.

- Show The Us Map
- Show Usa Map
- Show Map Of The Usa
- Show Map Of Us States
- Show Map Of The Us
- Show Map Of United States
- Benefit Corporation legislation - Thematic map | Ranks US states by ...
- Show Map Of Usa
- Show Map Of Germany
- Design elements - 3D directional maps | Landmarks - Vector stencils ...
- Design elements - Thematic maps | Visualization Spatial Data Using ...
- Us Map Showing States
- Benefit Corporation legislation - Thematic map | USA Maps | Geo ...
- How to Draw a Map of North America Using ConceptDraw PRO ...
- How to Present a Slide- Show via Skype Using Remote Presentation ...
- Us Color Coded Map
- Map of USA with state names | Benefit Corporation legislation ...
- Languages of South America - Thematic map | Europe thematic map ...
- How To Do A Mind Map In PowerPoint | Presenting a Slide Show to ...
- Bubble Charts | Bubble Chart Maker | Bubble Map Maker ...
- ERD | Entity Relationship Diagrams, ERD Software for Mac and Win
- Flowchart | Basic Flowchart Symbols and Meaning
- Flowchart | Flowchart Design - Symbols, Shapes, Stencils and Icons
- Flowchart | Flow Chart Symbols
- Electrical | Electrical Drawing - Wiring and Circuits Schematics
- Flowchart | Common Flowchart Symbols