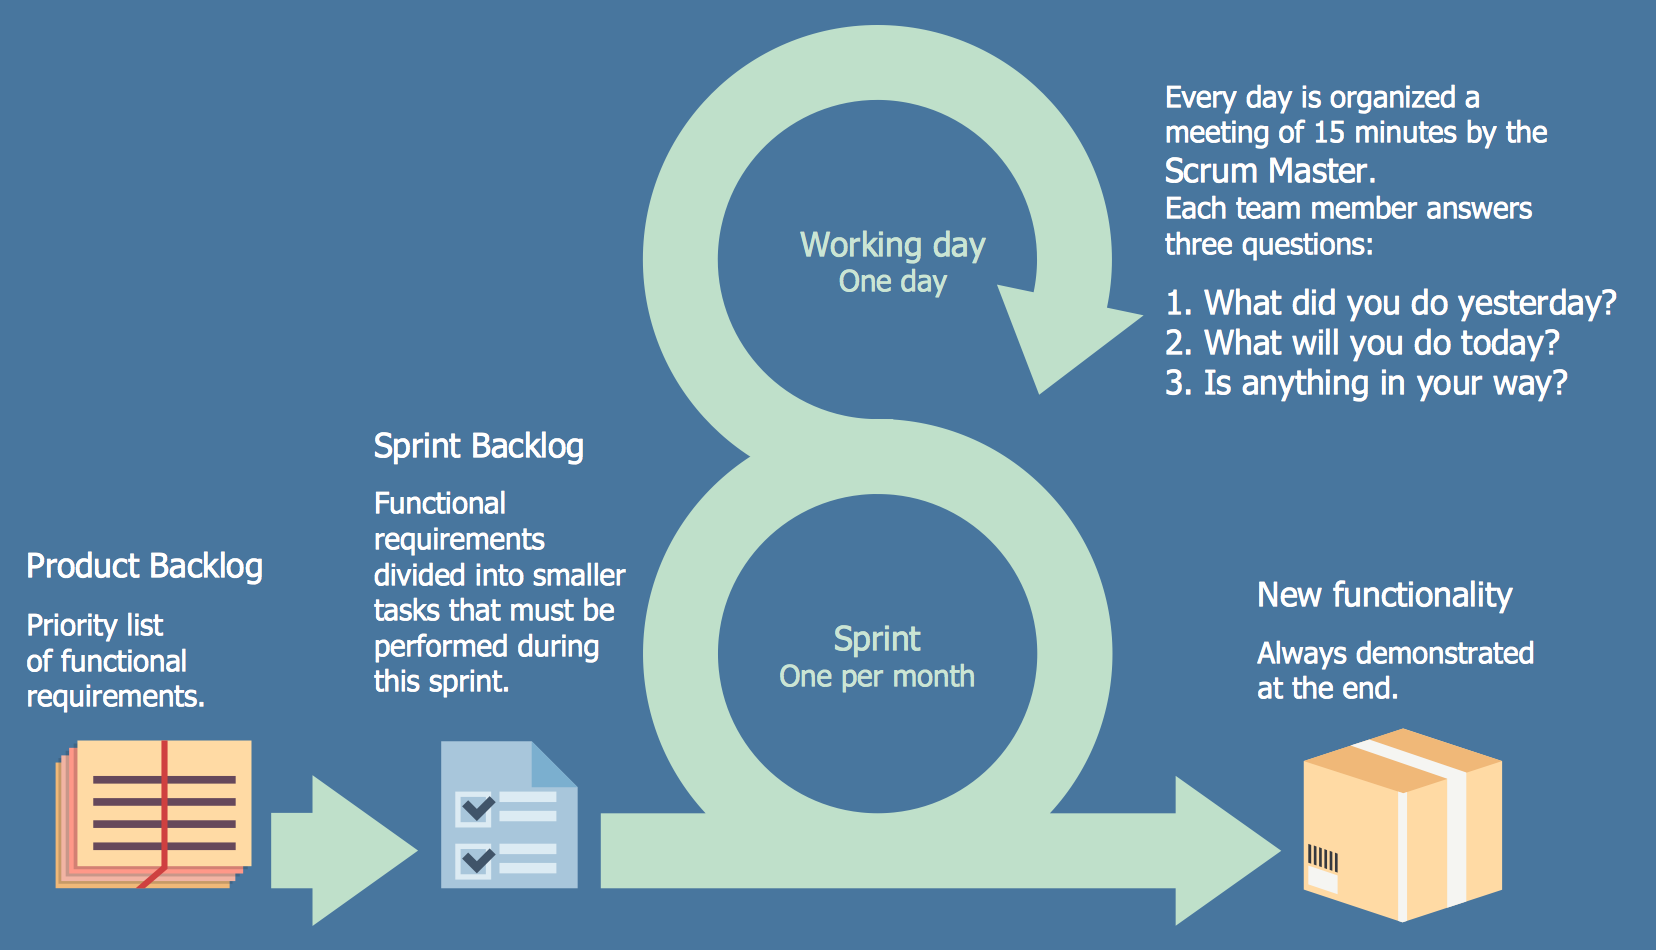
This site uses cookies. By continuing to browse the ConceptDraw site you are agreeing to our Use of Site Cookies.

Scrum

What is Scrum? Scrum is the famous agile software development methodology which depicts an iterative and incremental approach for the work on the complex projects. Use ConceptDraw DIAGRAM diagramming and vector drawing software extended with SCRUM Workflow solution to draw various types of professional-looking Scrum Charts, Scrum Workflow Diagrams, Scrum Mind Maps, Scrum boards and attractive Scrum Infographics.

Agile Methodology

Agile methodology is an excellent alternative to waterfall and traditional sequential development. ConceptDraw DIAGRAM software extended with SCRUM Workflow solution is ideal for quick and easy designing various diagrams, charts, mind maps and schematics illustrating software development using Agile methodologies, and in particular Scrum methodology.

Scrum process work items and workflow

Teams working with Scrum methodology use the product backlog items (PBIs), bug work item types (WITs), reports and dashboards. SCRUM Workflow solution for ConceptDraw DIAGRAM software offers collection of samples, variety of predesigned objects, clipart and graphic elements, a set of Scrum process work items and workflow which are developed for agile teams working using Scrum.

SSADM Diagram

The vector stencils library SSADM from the solution Systems engineering contains specific symbols of SSADM diagrams for ConceptDraw DIAGRAM diagramming and vector drawing software. The Systems engineering solution is contained in Software Development area of ConceptDraw Solution Park.
The example below illustrates the waterfall model used in SSADM. This model involves 5 stages of developing a product such as requirements specification and its' analysis, design, coding and testing.

How To Create a Workflow Diagram

A workflow diagram is less general notation than a process flow diagram. Workflow as a term can apply to organizational process which involves people, resources, documents, sort of data, for instance; whereas a process is general collection of steps occuring in any sort of activity. That is why process flow diagram can be used as workflow diagram to describe business process, data flow or department interactions.

The fastest way to create a workflow diagram is using pre-designed workflow template. ConceptDraw DIAGRAM with the Workflow Diagrams solution delivers rich set of workflow diagram templates you may start from.

scrum, agile methodology, scrum methodology, scrum board Scrum Workflow

scrum, agile methodology, scrum methodology, scrum board
The Scrum Workflow Solution extends the capabilities of ConceptDraw DIAGRAM with a large collection of professionally-designed samples and a selection of ready-to-use scrum design elements: scrum diagrams and arrows, scrum icons of people, artifacts, workflow, workspace and other colorful scrum clipart, and also scrum charts.

Scrum workflow

ConceptDraw DIAGRAM diagramming and vector drawing software extended with unique SCRUM Workflow solution from the Project Management area of ConceptDraw Solution Park allows fast and easy design professional-looking Scrum Workflow Diagrams and Scrum workflow scheme for projects required when working on projects and managing them, when developing software with cutting-edge Agile methodologies.
HelpDesk

How to Create a Release Burn-Down Chart
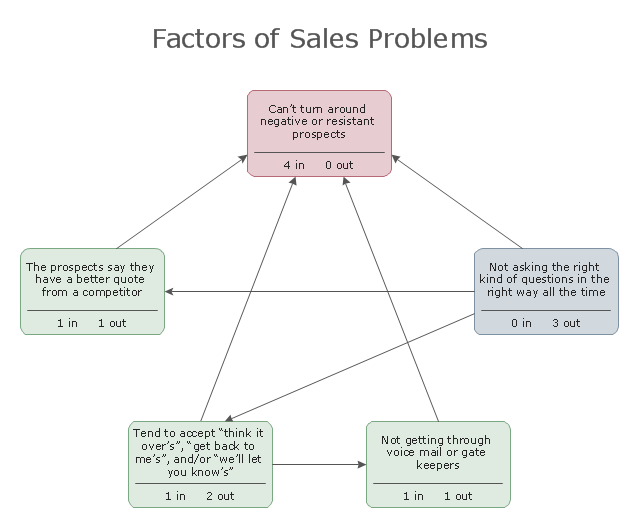
The Agile methodology provides project teams the ability to quickly adapt the project to the current situation and thus achieve maximum productivity. According to the Scrum method, the steps needed to fulfill the project goal breaks down by using short sprints or iterations. The iterations together with an extensive collaboration can increase productivity by better understanding the entire flow of a project. A release burn-down chart is used to track progress on a Scrum project. The ConceptDraw Scrum Workflow Solution makes it easy for Agile project team to build any professional Scrum diagram such as a Release velocity chart, Release burn-down chart, Sprint burn-down chart, or a Team velocity chart.

Relations Diagram

Identify what factors are causes and which factors are effects.
Factors that are causes are called "Drivers"; a consequence of factors is called "Indicators".
Indicators help establish KPI (Key Performance Indicators) to monitor changes and the effectiveness of corrective actions in resolving a problem.