Pyramid Diagram

The vector stencils library "Target diagrams" contains 13 templates of target diagrams: marketing mix diagram, principles of marketing diagram, circle diagram, macro-micro environment diagram, stakeholder diagram, target market scope diagram.
Use these shapes to illustrate your marketing and sales documents, presentations, webpages and infographics in the ConceptDraw PRO diagramming and vector drawing software extended with the Target and Circular Diagrams solution from the Marketing area of ConceptDraw Solution Park.
www.conceptdraw.com/ solution-park/ marketing-target-and-circular-diagrams
Principles of marketing by Ph. Kotler

Marketing mix

Target

Principles of marketing by Ph. Kotler (prompt)
-target-diagrams---vector-stencils-library.png--diagram-flowchart-example.png)
Circle diagram

Macro-micro environmental forces diagram

Macro-micro environmental forces diagram (prompt)
-target-diagrams---vector-stencils-library.png--diagram-flowchart-example.png)
Stakeholder diagram

Target market scope diagram

Target diagram 1

Target diagram 2

Target diagram 3

Target diagram

The vector stencils library "Target diagrams" contains 13 templates of target diagrams: marketing mix diagram, principles of marketing diagram, circle diagram, macro-micro environment diagram, stakeholder diagram, target market scope diagram.
Use these shapes to illustrate your marketing and sales documents, presentations, webpages and infographics in the ConceptDraw PRO diagramming and vector drawing software extended with the Target and Circular Diagrams solution from the Marketing area of ConceptDraw Solution Park.
www.conceptdraw.com/ solution-park/ marketing-target-and-circular-diagrams
Use these shapes to illustrate your marketing and sales documents, presentations, webpages and infographics in the ConceptDraw PRO diagramming and vector drawing software extended with the Target and Circular Diagrams solution from the Marketing area of ConceptDraw Solution Park.
www.conceptdraw.com/ solution-park/ marketing-target-and-circular-diagrams
Principles of marketing by Ph. Kotler
Marketing mix
Target
Principles of marketing by Ph. Kotler (prompt)
Circle diagram
Macro-micro environmental forces diagram
Macro-micro environmental forces diagram (prompt)
Stakeholder diagram
Target market scope diagram
Target diagram 1
Target diagram 2
Target diagram 3
Target diagram
Pyramid Diagram

TQM Diagram Tool

 Marketing
This solution extends ConceptDraw DIAGRAM and ConceptDraw MINDMAP with Marketing Diagrams and Mind Maps (brainstorming, preparing and holding meetings and presentations, sales calls).
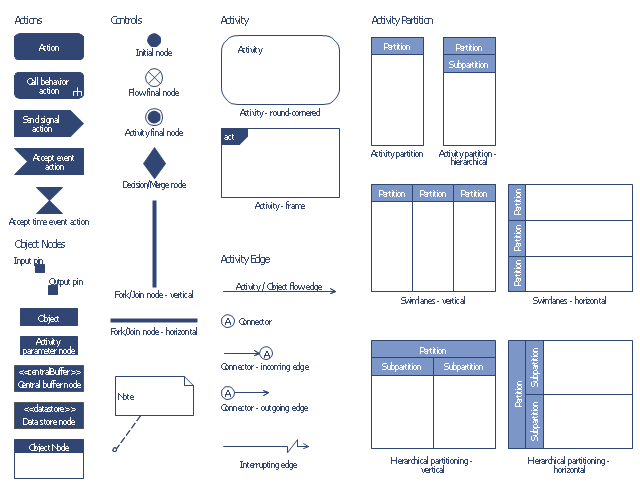
The vector stencils library "Bank UML activity diagram" contains 32 shapes of UML activity diagram.
Use it for object-oriented modeling of your bank information system.
"Activity diagrams are constructed from a limited number of shapes, connected with arrows. The most important shape types:
* rounded rectangles represent actions;
* diamonds represent decisions;
* bars represent the start (split) or end (join) of concurrent activities;
* a black circle represents the start (initial state) of the workflow;
* an encircled black circle represents the end (final state).
Arrows run from the start towards the end and represent the order in which activities happen.
Activity diagrams may be regarded as a form of flowchart. Typical flowchart techniques lack constructs for expressing concurrency. However, the join and split symbols in activity diagrams only resolve this for simple cases; the meaning of the model is not clear when they are arbitrarily combined with decisions or loops.
While in UML 1.x, activity diagrams were a specialized form of state diagrams, in UML 2.x, the activity diagrams were reformalized to be based on Petri net-like semantics, increasing the scope of situations that can be modeled using activity diagrams. These changes cause many UML 1.x activity diagrams to be interpreted differently in UML 2.x." [Activity diagram. Wikipedia]
This example of UML activity diagram symbols for the ConceptDraw PRO diagramming and vector drawing software is included in the ATM UML Diagrams solution from the Software Development area of ConceptDraw Solution Park.
UML activity diagram symbols
Pyramid Diagram

Pyramid Diagram

Pyramid Diagram

Local area network (LAN). Computer and Network Examples
 diagram")

HelpDesk
How to Create Project Diagrams on PC

Pyramid Diagram

Pyramid Diagram

- Diagram Of The Scope Of Marketing
- Pyramid Diagram | Pyramid Diagram | Business Productivity ...
- Scope Of Marketing Diagram
- Scope Of Export Marketing With Diagram
- Scope Of Work Market Study Diagrams
- Block Diagram Of Scope Of Marketing
- Scope Diagram Of Marketing
- Target diagrams - Vector stencils library | Target market | Target and ...
- Scope Diagram Template
- Marketing mix - Wheel diagram | Target diagrams - Vector stencils ...
- Scope Of Industrial Management Diagrams
- Pie Chart Examples and Templates | Target and Circular Diagrams ...
- Computer Network Diagrams | Scope Functions Of Sales ...
- Target market scope diagram
- Competitor Analysis | Target diagrams - Vector stencils library ...
- Target and Circular Diagrams | Project Scope Lens Diagram
- Target diagrams - Vector stencils library | Target diagrams - Vector ...
- Target diagrams - Vector stencils library | Target diagrams - Vector ...
- Marketing | Competitor Analysis | Target diagrams - Vector stencils ...