HelpDesk
How to Create Multple Projects Schedule on Windows

HelpDesk
How to Create Multiple Projects Schedule on OS X

Daily Schedule Chart

"Time management is the .. process of planning and exercising conscious control over the amount of time spent on specific activities, especially to increase effectiveness, efficiency or productivity. Time management may be aided by a range of skills, tools, and techniques used to manage time when accomplishing specific tasks, projects, and goals complying with a due date. Initially, time management referred to just business or work activities, but eventually the term broadened to include personal activities as well. A time management system is a designed combination of processes, tools, techniques, and methods. Time management is usually a necessity in any project development as it determines the project completion time and scope." [Time management. Wikipedia]
This timetable pie chart shows the plan of daily actions and its durations in minutes.
It is useful visual tool of personal time management.
This schedule pie chart example was created using the ConceptDraw PRO diagramming and vector drawing software extended with the Target and Circular Diagrams solution from the Marketing area of ConceptDraw Solution Park.
www.conceptdraw.com/ solution-park/ marketing-target-and-circular-diagrams
Daily activities pie chart

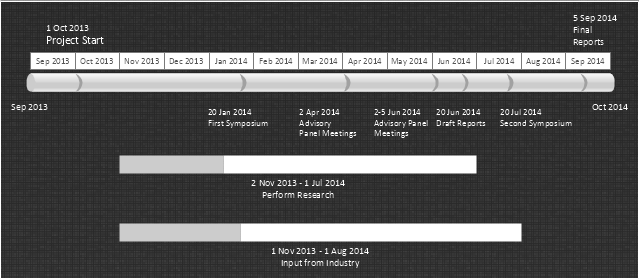
"In project management, a schedule is a listing of a project's milestones, activities, and deliverables, usually with intended start and finish dates. Those items are often estimated in terms of resource allocation, budget and duration, linked by dependencies and scheduled events. A schedule is commonly used in project planning and project portfolio management parts of project management. Elements on a schedule may be closely related to the Work Breakdown Structure (WBS) terminal elements, the Statement of work, or a Contract Data Requirements List." [Schedule (project management). Wikipedia]
The timeline diagram example "Project schedule" was created using the ConceptDraw PRO diagramming and vector drawing software extended with the Timeline Diagrams solution from the Management area of ConceptDraw Solution Park.
The timeline diagram example "Project schedule" was created using the ConceptDraw PRO diagramming and vector drawing software extended with the Timeline Diagrams solution from the Management area of ConceptDraw Solution Park.
Project schedule
CORRECTIVE ACTIONS PLANNING. PERT Chart


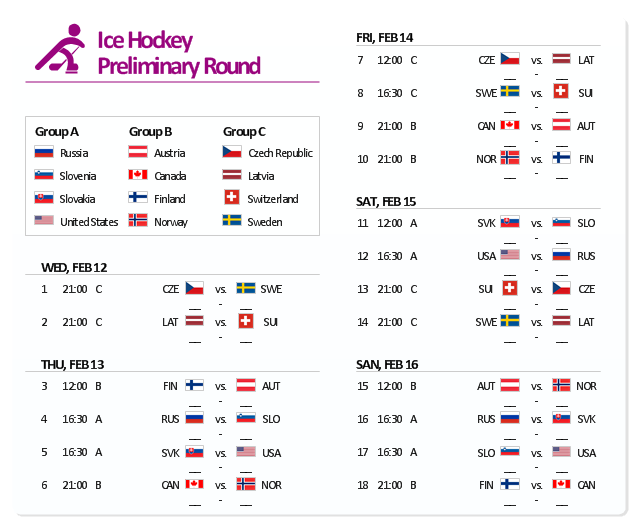
Winter Sports. Using Olympic Games Clipart to Illustrate Tournament Schedule

The example "Sochi 2014 Olympics - Men’s hockey tournament schedule" represent Ice Hockey schedule of XXII Olympic Winter Games according to Sochi2014.com website. [sochi2014.com/ en/ ice-hockey-schedule-and-results]
"The 2014 Winter Olympics, officially the XXII Olympic Winter Games, or the 22nd Winter Olympics, are scheduled to take place from 6 to 23 February 2014, in Sochi, Russia, with some events held in the resort town of Krasnaya Polyana. Ninety-eight events in fifteen winter sports will be held. Both the Olympics and 2014 Winter Paralympics are being organized by the Sochi Organizing Committee (SOC). ...
The events of the 2014 Winter Olympics will be held around two clusters of new venues; an Olympic Park was constructed in the Imeretinsky Valley on the coast of the Black Sea, with Fisht Olympic Stadium and the Games' indoor venues located within walking distance, and snow events will be held at Krasnaya Polyana." [2014 Winter Olympics. Wikipedia]
The example "Sochi 2014 Olympics - Men’s hockey tournament schedule" was created using the ConceptDraw PRO diagramming and vector drawing software extended with the Winter Sports solution. The Winter Sports solution from the Sport area of ConceptDraw Solution Park contains the vector stencils library "Winter sports pictograms" and examples of diagrams and infographics.
Men’s hockey tournament schedule
HelpDesk
How to Operate with Project Time Frames in ConceptDraw PROJECT

"Project planning is part of project management, which relates to the use of schedules such as Gantt charts to plan and subsequently report progress within the project environment.
Initially, the project scope is defined and the appropriate methods for completing the project are determined. Following this step, the durations for the various tasks necessary to complete the work are listed and grouped into a work breakdown structure. Project planning is often used to organize different areas of a project, including project plans, work loads and the management of teams and individuals. The logical dependencies between tasks are defined using an activity network diagram that enables identification of the critical path. Float or slack time in the schedule can be calculated using project management software. Then the necessary resources can be estimated and costs for each activity can be allocated to each resource, giving the total project cost. At this stage, the project schedule may be optimized to achieve the appropriate balance between resource usage and project duration to comply with the project objectives. Once established and agreed, the project schedule becomes what is known as the baseline schedule. Progress will be measured against the baseline schedule throughout the life of the project. Analyzing progress compared to the baseline schedule is known as earned value management.
The inputs of the project planning phase include the project charter and the concept proposal. The outputs of the project planning phase include the project requirements, the project schedule, and the project management plan." [Project planning. Wikipedia]
The flow chart example "Project planning process" was created using the ConceptDraw PRO diagramming and vector drawing software extended with the Flowcharts solution from the area "What is a Diagram" of ConceptDraw Solution Park.
Flowchart - Project planning process

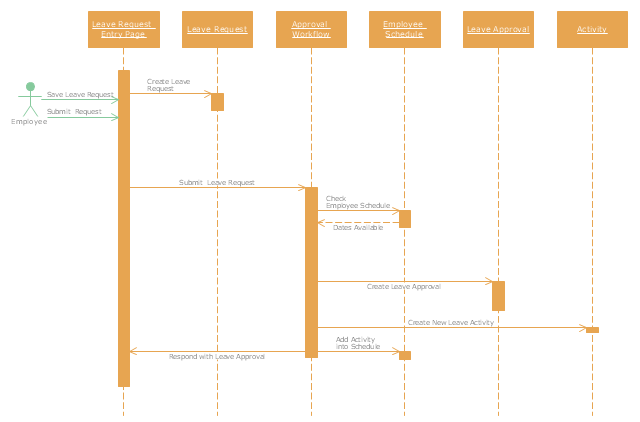
"A schedule or timetable is a basic time management tool consisting of a list of times at which possible tasks, events, or actions are intended to take place, or a sequence of events in the chronological order in which such things are intended to take place. The process of creating a schedule - deciding how to order these tasks and how to commit resources between the variety of possible tasks - is called scheduling, and a person responsible for making a particular schedule may be called a scheduler. Making and following schedules is a fundamental human activity, and learning to do these things effectively is one of the most basic life skills. There are a wide variety of situations in which schedules are necessary, or at least useful.
Schedules are useful for both short periods, such as a daily or weekly schedule, and for long term planning with respect to periods of several months or years. They are often made using a calendar, where the person making the schedule can note the dates and times at which various events are planned to occur. Schedules that do not set forth specific times for events to occur may instead list an expected order in which events either can or must take place." [Schedule. Wikipedia]
The UML sequence diagram example "Checking process" was created using the ConceptDraw PRO diagramming and vector drawing software extended with the Rapid UML solution from the Software Development area of ConceptDraw Solution Park.
UML sequence diagram
Activity Network (PERT) Chart

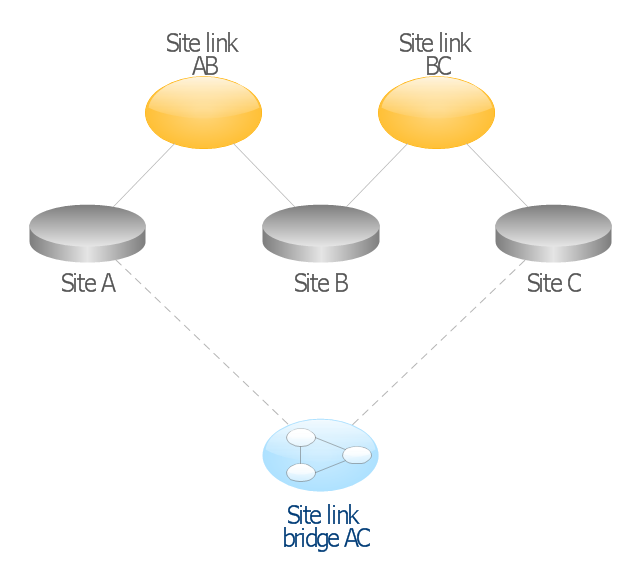
This AD diagram example was redesigned from the picture "Site links" from the book "Active Directory for Dummies".
"Site links represent the Active Directory replication paths between sites.
These paths are manually defined so that the designer has control over which network links the replication traffic occurs on. These site links also control how clients are directed to domain controllers when there’s no DC in the client’s local site. Each site link has the following attributes:
(1) Connected sites: A site link is defined by the sites to which it connects. A site link can connect two or more sites together.
(2) Network transport: Site links support replication communication over IP-based RPCs or with the Simple Mail Transport Protocol (SMTP). You normally want to use RPC whenever possible, but you can use SMTP when the sites you’re linking don’t support RPC.
(3) Cost: Each site link has a cost associated with it. Costs are used to assign preferences to links that determine which link should be followed when multiple link paths are available between sites. The cost represents what it “costs” to use this site link relative to the other site links and affects replication traffic as well as how users are assigned a domain controller. Links with lower cost values have preference over links with higher cost values. Cost values range from 1–32,767; the default being 100.
(4) Frequency: The frequency value defines how often a replication occurs
when using this site link (the replication latency). You can configure the time between replications from a minimum of 15 minutes to a maximum of 10,080 minutes (one week). The default frequency is 180 minutes.
(5) Schedule: The schedule dictates when this link is active and available for replication between the sites. The schedule can also control which days of the week the link is available. Normally, the schedule is set so that the link is available 24 hours a day, but you can set up different schedules on a per-day-of-the-week basis.
By creating a site link, you enable two or more sites to be connected and to share the same site link attributes (transport, cost, frequency, and schedule). By default, site links create transitive connectivity between sites.
If you create a site link between sites A and B and another site link between
sites B and C, an automatic connection (known as a site link bridge) is created between sites A and C..." [Steve Clines and Marcia Loughry, Active Directory® For Dummies®, 2nd Edition. 2008]
The Active Directory diagram example "Site links" was created using the ConceptDraw PRO diagramming and vector drawing software extended with the Active Directory Diagrams solution from the Computer and Networks area of ConceptDraw Solution Park.
Active Directory network diagram
HelpDesk
How to Edit a Project Task List

HelpDesk
How to Make a Mind Map from a Project Gantt Chart

- How to Create Multple Projects Schedule on Windows | How to ...
- Daily Schedule Chart | Business diagrams & Org Charts with ...
- Timeline diagram - Project schedule
- CORRECTIVE ACTIONS PLANNING PERT Chart | Flowchart ...
- Daily Schedule Chart | Schedule pie chart - Daily action plan ...
- Schedule pie chart - Daily action plan | UML sequence diagram ...
- Project schedule
- CORRECTIVE ACTIONS PLANNING. PERT Chart | Daily Schedule ...
- Timeline diagram - Project schedule | Business diagrams & Org ...
- Schedule pie chart - Daily action plan | Gant Chart in Project ...
- PM Easy | Product Overview | Timeline diagram - Project schedule ...
- Timeline diagram - Project schedule | How to Report Task's ...
- PM Personal Time Management | Schedule pie chart - Daily action ...
- Schedule pie chart - Daily action plan | Target and Circular ...
- Schedule pie chart - Daily action plan | Think and act effectively ...
- Schedule pie chart - Daily action plan | How to Draw the Different ...
- Daily Schedule Chart | Interior Design Plumbing - Design Elements ...
- Schedule pie chart - Daily action plan | Design elements - Calendars ...
- Daily Schedule Chart | Schedule pie chart - Daily action plan ...
- Schedule pie chart - Daily action plan | Circle Graph Sample Stident ...