Cross-Functional Process Map Template
When you need a drawing software to create a professional looking cross-functional charts, ConceptDraw with its Arrows10 Technology - is more than enough versatility to draw any type of diagram with any degree of complexity. Use templates with process maps, diagrams, charts to get the drawing in minutes.
 Cross-Functional Flowcharts
Cross-functional flowcharts are powerful and useful tool for visualizing and analyzing complex business processes which requires involvement of multiple people, teams or even departments. They let clearly represent a sequence of the process steps, the order of operations, relationships between processes and responsible functional units (such as departments or positions).
 Value Stream Mapping
Value stream mapping solution extends ConceptDraw PRO software with templates, samples and vector stencils for drawing the Value Stream Maps (VSM) in lean manufacturing practice.
 Business Process Mapping
The Business Process Mapping solution for ConceptDraw PRO is for users involved in process mapping and creating SIPOC diagrams.
"Value Stream Map (VSM)
1. A tool used to improve a process by identifying added value and eliminating waste.
2. A process map that follows the value creation process.
A. “strap yourself to the product (or service) and see where you go”
3. A process map with data added.
A. Times: processing, wait, cycle.
B. Quality: number of rejects.
C. Inventory.
D. Resources.
1) Number of people.
2) Space.
3) Distance traveled.
E. Whatever else is useful for analyzing the process." [ocw.mit.edu/ courses/ aeronautics-and-astronautics/ 16-660j-introduction-to-lean-six-sigma-methods-january-iap-2012/ lecture-notes/ MIT16_ 660JIAP12_ 1-6.pdf]
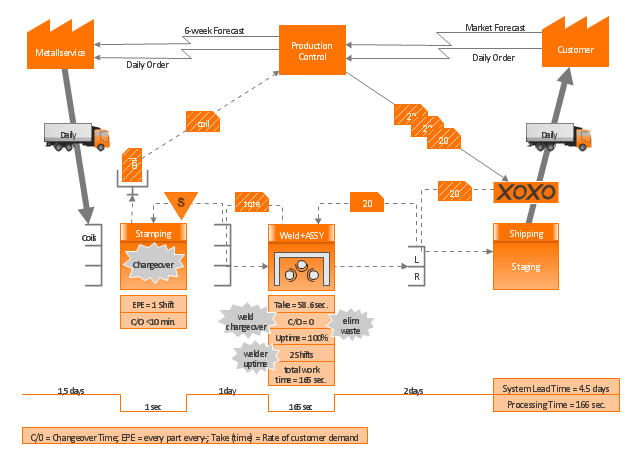
This sample VSM flowchart shows the value stream in a manufacturing, production control and shipping processes.
This value stream mapping diagram example was created using the ConceptDraw PRO diagramming and vector drawing software extended with the Value Stream Mapping solution from the Quality area of ConceptDraw Solution Park.
Cross Functional Flowchart for Business Process Mapping
Start your business process mapping with conceptDraw PRO and its Arrows10 Technology. Creating a process map, also called a flowchart, is a major component of Six Sigma process management and improvement. Use Cross-Functional Flowchart drawing software for business process mapping (BPM). Use a variety of drawing tools, smart connectors and shape libraries to create flowcharts of complex processes, procedures and information exchange. Define and document basic work and data flows, financial, production and quality management processes to increase efficiency of you business.
 Event-driven Process Chain Diagrams
Event-driven Process Chain (EPC) Diagram is a type of flowchart widely used for modeling in business engineering and reengineering, business process improvement, and analysis. EPC method was developed within the Architecture of Integrated Information Systems (ARIS) framework.
- Cross-Functional Process Map Template
- Payroll process - Swim lane process mapping diagram | Cross ...
- Swim Lane Diagrams | Cross-Functional Flowchart (Swim Lanes ...
- Swimlanes Process Map
- Payroll process - Swim lane process mapping diagram | Design ...
- Payroll process - Swim lane process mapping diagram | Business ...
- Process Flowchart | Cross-Functional Process Map Template | What ...
- Business Diagram Software | Value stream mapping diagram ...
- Payroll Process Flowchart Example
- Value Added Process Mapping
- Example Of Process Mapping For Enrollment
- Cross-Functional Flowchart (Swim Lanes) | Payroll process - Swim ...
- Cross-Functional Flowcharts | Payroll process - Swim lane process ...
- Payroll process - Swim lane process mapping diagram | Booch OOD ...
- Payroll process - Swim lane process mapping diagram | How to ...
- Cross-Functional Process Map Template | Swim lane process map ...
- Process Mapping Of Shipment
- Cross-Functional Flowchart | Cross-Functional Process Map ...
- Cross-Functional Process Map Template | Business Process ...


