Learn how to create a current state value stream map

Basic Diagramming


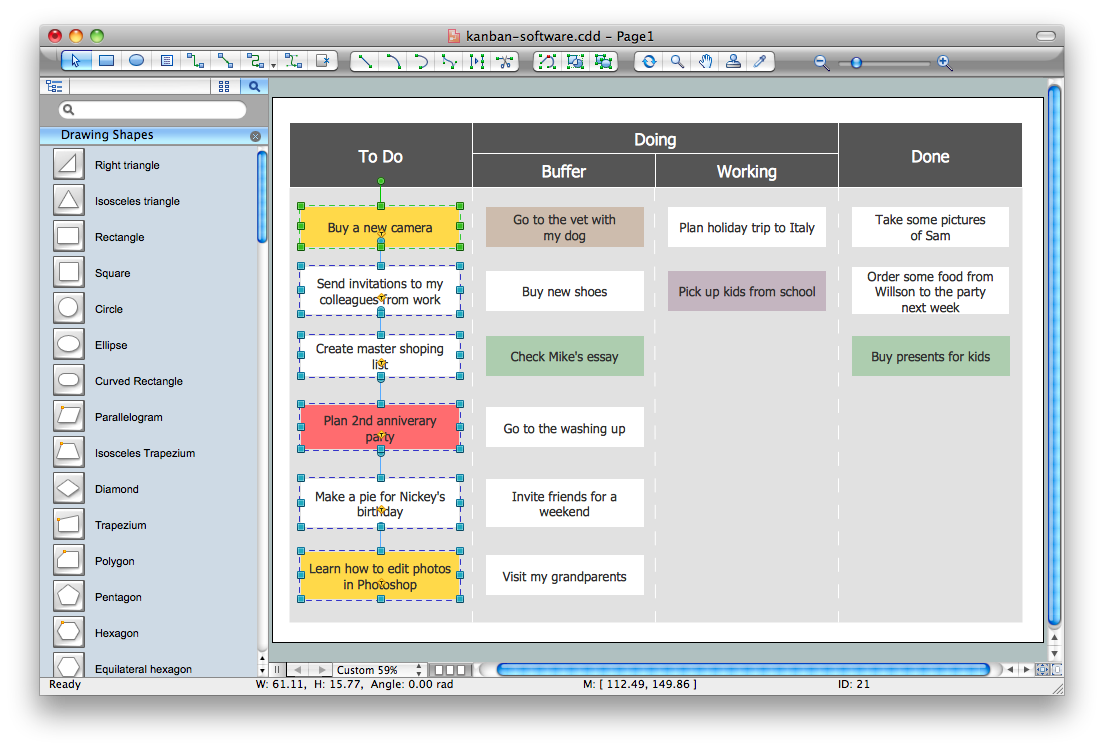
Kanban Board Software
How To Create a FlowChart using ConceptDraw

Flowchart Example: Flow Chart of Marketing Analysis

Cross Functional Flowchart Examples

Material Requisition Flowchart. Flowchart Examples

How to draw Metro Map style infographics? Moscow, New York, Los Angeles, London

Value Stream & Process Flow Diagramming Software

Value stream with ConceptDraw DIAGRAM

ConceptDraw Arrows10 Technology

Lean Six Sigma Diagram Software

Process Flow Chart Symbols

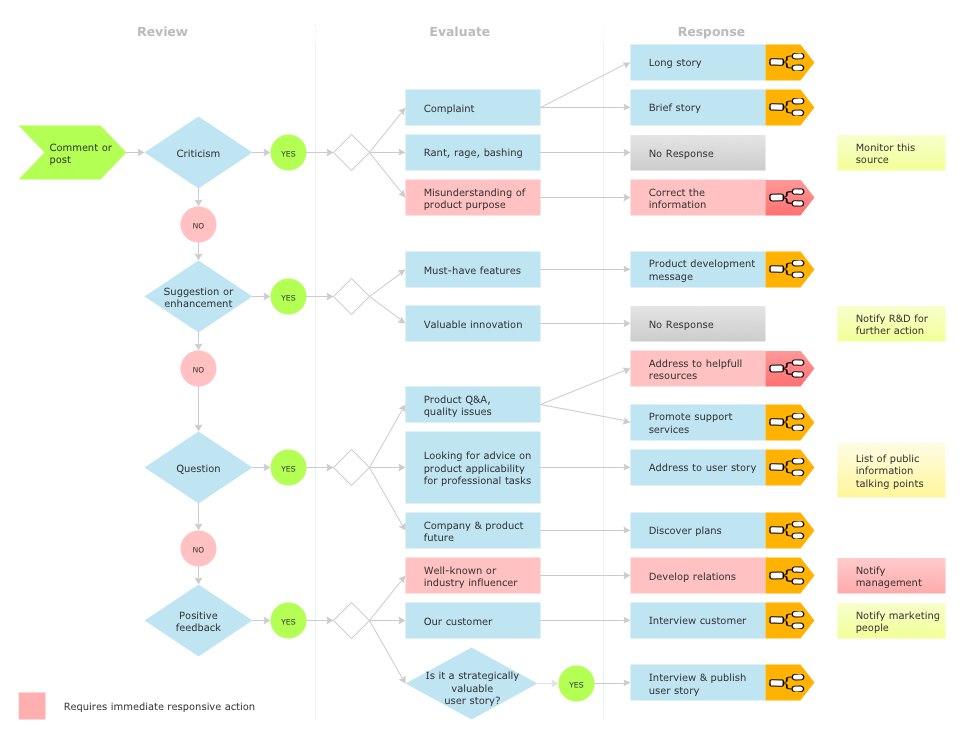
Social Media Response DFD Flowcharts - diagramming software ( Mac PC )

Best Value Stream Mapping mac Software

- Picture Graphs | Basic Flowchart Symbols and Meaning | Types of ...
- Basic Flowchart Images . Flowchart Examples | Manufacturing and ...
- Value- Stream Mapping for Manufacturing | Lean Manufacturing ...
- Line Chart Examples | Pictures of Graphs | Types of Flowchart ...
- Process Flowchart | Flowchart Marketing Process. Flowchart ...
- Basic Flowchart Symbols and Meaning | Process Flowchart | Value ...
- Images For Physics Chart
- The Pictorial Picture Bar Chart And Histogram
- Organizational Chart Images
- Picture Graphs | ConceptDraw Solution Park | Total Quality ...
- Picture Graphs | Barrie population - Picture bar graph | Academic ...
- Picture Graphs | ConceptDraw Solution Park | Bar Graphs | Pictorial ...
- Picture Graphs | ConceptDraw Solution Park | Graphs and Charts ...
- Picture Graphs | ConceptDraw Solution Park | Bar Graphs | Picture ...
- Design elements - Picture bar graphs | Picture Graphs ...
- Manufacturing Pictures Diagram
- Value Stream Mapping | Fishbone Diagrams | Entity-Relationship ...
- Sample Pictorial Chart . Sample Infographics | Pictorial Chart | Line ...
- Picture Graphs | ConceptDraw Solution Park | Germany Map ...
- Lean Manufacturing Diagrams | Value- Stream Mapping for ...