Software development with ConceptDraw PRO

Data structure diagram with ConceptDraw PRO

Basic Flowchart Symbols and Meaning


Flowchart Software

 Event-driven Process Chain Diagrams
Event-driven Process Chain (EPC) Diagram is a type of flowchart widely used for modeling in business engineering and reengineering, business process improvement, and analysis. EPC method was developed within the Architecture of Integrated Information Systems (ARIS) framework.
 Entity-Relationship Diagram (ERD)
An Entity-Relationship Diagram (ERD) is a visual presentation of entities and relationships. That type of diagrams is often used in the semi-structured or unstructured data in databases and information systems. At first glance ERD is similar to a flowch
Chart Examples

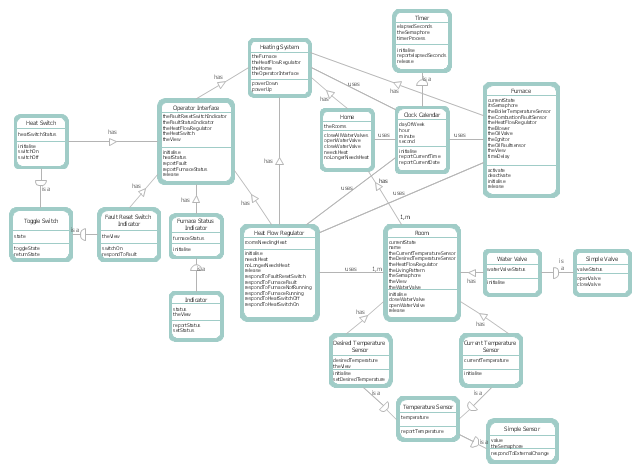
This DFD sample was created on the base of the figure illustrating "A Survey of Object-Oriented Methods" by Peter Biggs from University of Durham.
[students.cs.byu.edu/ ~pbiggs/ images/ coadsys.gif]
"Object-oriented analysis and design (OOAD) is a popular technical approach to analyzing, designing an application, system, or business by applying the object-oriented paradigm and visual modeling throughout the development life cycles to foster better stakeholder communication and product quality.
According to the popular guide Unified Process, OOAD in modern software engineering is best conducted in an iterative and incremental way. Iteration by iteration, the outputs of OOAD activities, analysis models for OOA and design models for OOD respectively, will be refined and evolve continuously driven by key factors like risks and business values." [Object-oriented analysis and design. Wikipedia]
The DFD example "Coad/ Yourdon's Object-Oriented Analysis model" was created using the ConceptDraw PRO diagramming and vector drawing software extended with the Data Flow Diagrams solution from the Software Development area of ConceptDraw Solution Park.
DFD
 School and Training Plans
Planning a school and its campus layout needs to depict the premises, represent internal spaces, location of windows and direction of natural light. Detailed classroom seating chart helps you visualize location of the blackboard and desks, taking into account the specifics of the room and its lighting, with a goal to design the classroom to be comfortable for each pupil and teacher.
 Line Graphs
How to draw a Line Graph with ease? The Line Graphs solution extends the capabilities of ConceptDraw PRO v10 with professionally designed templates, samples, and a library of vector stencils for drawing perfect Line Graphs.
 eLearning for Skype
This solution extends ConceptDraw MINDMAP software with the ability to prepare and run remote learning sessions by using Skype
 Mechanical Engineering
This solution extends ConceptDraw PRO v.9 mechanical drawing software (or later) with samples of mechanical drawing symbols, templates and libraries of design elements, for help when drafting mechanical engineering drawings, or parts, assembly, pneumatic,
Line Chart Examples

 Business Infographics Area
ConceptDraw Business Infographics Solutions helps you to design eye-catching marketing infographics, on subjects such as content marketing, education, IT, social media marketing, and marketing plans; allowing you to represent, share and explain various pi
 Collaboration Area
The solutions from Collaboration area of ConceptDraw Solution Park extend ConceptDraw PRO and ConceptDraw MINDMAP software with features, samples, templates and vector stencils libraries for drawing diagrams and mindmaps useful for collaboration.
HelpDesk
How to Draw a Gantt Chart Using ConceptDraw PRO

- Data flow diagram template
- Data Flow Diagrams | Types of Flowchart - Overview | Business ...
- Library Managment Dfd For Student
- Data Flow Diagram (DFD)
- Dfd Diagram For Defination Of Student Library System
- Data Flow Diagrams | Software and Database Design with ...
- DFD Library System | Data Flow Diagrams | DFD Library - Design ...
- Process Flowchart | Business Processes | Data Flow Diagrams ...
- How To Draw Data Flow Diagram
- Data Flow Diagrams
- Teacher Student Dfd
- Data Flow Diagrams with ConceptDraw PRO | Active Directory ...
- Example of DFD for Online Store ( Data Flow Diagram ). DFD ...
- Entity Relationship Diagram Software Engineering | Entity ...
- Simple Flowchart Software Examples For Students
- Structured Systems Analysis and Design Method (SSADM) with ...
- Student Teacher Dfd
- Data Flow Diagrams
- Data Flow Diagrams | ER Diagrams with ConceptDraw PRO ...
- Bio Flowchart Lite | Development of software with ConceptDraw ...