Sales Growth. Bar Graphs Example

 Picture Graphs
Typically, a Picture Graph has very broad usage. They many times used successfully in marketing, management, and manufacturing. The Picture Graphs Solution extends the capabilities of ConceptDraw DIAGRAM with templates, samples, and a library of professionally developed vector stencils for designing Picture Graphs.
 Line Graphs
How to draw a Line Graph with ease? The Line Graphs solution extends the capabilities of ConceptDraw DIAGRAM with professionally designed templates, samples, and a library of vector stencils for drawing perfect Line Graphs.
Sales Dashboard

Growth-Share Matrix Software

Ansoff Matrix

Matrices
How to Make SWOT Analysis in a Word Document

BCG Matrix

 Area Charts
Area Charts are used to display the cumulative totals over time using numbers or percentages; or to show trends over time among related attributes. The Area Chart is effective when comparing two or more quantities. Each series of data is typically represented with a different color, the use of color transparency in an object’s transparency shows overlapped areas and smaller areas hidden behind larger areas.
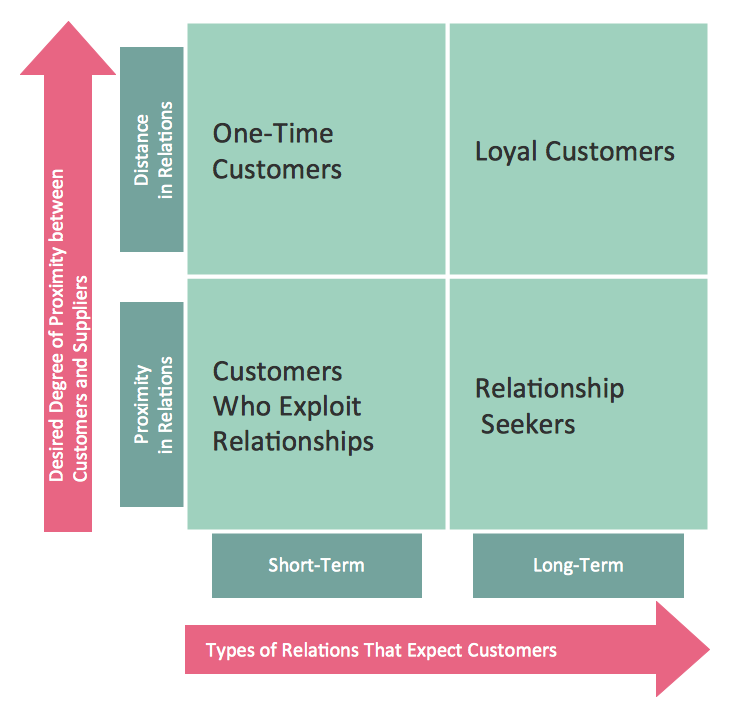
 Matrices
This solution extends ConceptDraw DIAGRAM software with samples, templates and library of design elements for drawing the business matrix diagrams.
 Football
The Football Solution extends ConceptDraw DIAGRAM software with samples, templates, and libraries of vector objects for drawing football (American) diagrams, plays schemas, and illustrations. It can be used to make professional looking documen
 Frequency Distribution Dashboard
Frequency distribution dashboard solution extends ConceptDraw DIAGRAM software with samples, templates and vector stencils libraries with histograms and area charts for drawing the visual dashboards showing frequency distribution of data.
 Collaboration Area
The solutions from Collaboration area of ConceptDraw Solution Park extend ConceptDraw DIAGRAM and ConceptDraw MINDMAP software with features, samples, templates and vector stencils libraries for drawing diagrams and mindmaps useful for collaboration.
 Computer and Networks Area
The solutions from Computer and Networks Area of ConceptDraw Solution Park collect samples, templates and vector stencils libraries for drawing computer and network diagrams, schemes and technical drawings.
 PM Dashboards
The PM Dashboards solution extends the management boundaries of ConceptDraw DIAGRAM and ConceptDraw PROJECT products with an ability to demonstrate changes to the budget status, to show the project progress toward its objectives, to display clearly the identified key performance indicator (KPI) or the set of key performance indicators for any project. This solution provides you with examples and ability to generate three types of visual dashboards reports based on your project data Project Dashboard, Tactical Dashboard, and Radar Chart. By dynamically charting the project’s key performance indicators that are collected on one ConceptDraw DIAGRAM document page, all project participants, project managers, team members, team leaders, stakeholders, and the entire organizations, for which this solution is intended, have access to the daily status of projects they are involved in.
- Sales Growth . Bar Graphs Example | Sales Dashboard | Sales ...
- Sales Growth . Bar Graphs Example | Bar Chart Examples | Chart ...
- Sales Growth . Bar Graphs Example | Polar Graph | Chart Maker for ...
- Sales Growth . Bar Graphs Example
- Bar Graphs | Sales Growth . Bar Graphs Example | Bar Graph | Bar ...
- Sales Growth . Bar Graphs Example | Revenue Growth Graph
- Line Graphs | Basic Diagramming | Sales Growth . Bar Graphs ...
- Sales Growth . Bar Graphs Example | Sales department - Vector ...
- Create Graphs and Charts | Basic Diagramming | Sales Growth . Bar ...
- Financial Comparison Chart | Sales Growth . Bar Graphs Example ...
- Sales Growth . Bar Graphs Example | Bar Chart Examples | What Is a ...
- Bar Chart Software | Sales Growth . Bar Graphs Example | Column ...
- Sales Growth . Bar Graphs Example | Seven Management and ...
- Line Graph Charting Software | Create Graphs and Charts | Sales ...
- Sales Growth . Bar Graphs Example | Bar Chart Template for Word ...
- Sales Growth . Bar Graphs Example | Bar Diagrams for Problem ...
- Bar Chart Examples | Sales Growth . Bar Graphs Example | Financial ...
- Sales Growth . Bar Graphs Example | Basic Diagramming | Bar ...
- Sales Growth . Bar Graphs Example | Sales Dashboard | Bar Graphs ...
- Bar Graphs | Sales Growth . Bar Graphs Example | Bar Chart ...