 Seven Management and Planning Tools
Seven Management and Planning Tools solution extends ConceptDraw DIAGRAM and ConceptDraw MINDMAP with features, templates, samples and libraries of vector stencils for drawing management mind maps and diagrams.
CORRECTIVE ACTIONS PLANNING. Risk Diagram (PDPC)


PROBLEM ANALYSIS. Root Cause Analysis Tree Diagram

 Seven Management and Planning Tools
Seven Management and Planning Tools solution extends ConceptDraw DIAGRAM and ConceptDraw MINDMAP with features, templates, samples and libraries of vector stencils for drawing management mind maps and diagrams.
Prioritization Matrix

Root Cause Tree Diagram

Affinity Diagram

The Action Plan

PDPC

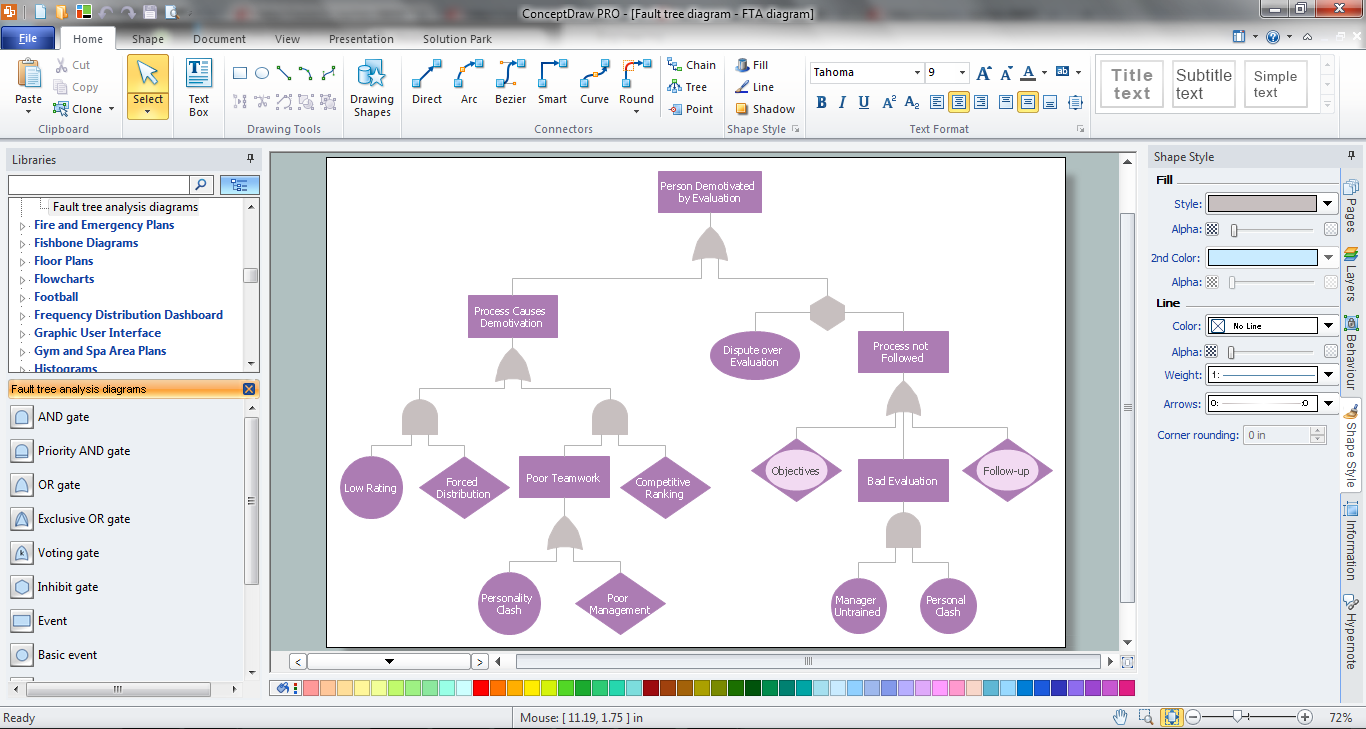
Fault Tree Analysis Software
Decision Making

Workflow Diagram

 Management Area
The solutions from Management area of ConceptDraw Solution Park collect templates, samples and libraries of vector stencils for drawing the management diagrams and mind maps.
- PROBLEM ANALYSIS. Root Cause Analysis Tree Diagram ...
- Prioritization matrix - Health care problems | Prioritization Matrix ...
- Root Cause Analysis Tools For Healthcare
- Entity Relationship Diagram Symbols | PROBLEM ANALYSIS . Root ...
- Root cause analysis tree diagram - Template | PROBLEM ...
- Example Of Tree Diagram In Health
- PROBLEM ANALYSIS. Root Cause Analysis Tree Diagram | Cause ...
- Cause and Effect Analysis | Root Cause Analysis | PROBLEM ...
- Cause And Effect Diagram Examples In Healthcare
- Relationships Analysis | CORRECTIVE ACTIONS PLANNING. Risk ...
- Relations diagram - Health care | PROBLEM ANALYSIS . Relations ...
- UML Class Diagram Example - Medical Shop | UML Diagram ...
- Cause Consequence Diagram
- Prioritization matrix - Health care problems | Seven Management ...
- Diagram Of Health Management
- Cause And Effect Analysis Example
- PROBLEM ANALYSIS . Prioritization Matrix | Prioritization Matrix ...
- Cause and Effect Analysis - Fishbone Diagrams for Problem Solving ...
- Healthcare Management Plan
- CORRECTIVE ACTIONS PLANNING. Risk Diagram (PDPC) | How ...