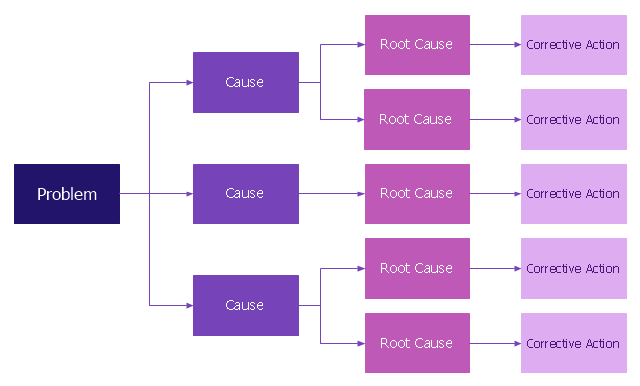
Root cause analysis (RCA) tree diagram lets identify the root causes for a factor and then list possible corrective action. The diagram displays the structure of causes for a factor and possible corrective actions. The root cause analysis tree diagram is used for further formulation of actions.
"Tree Diagram.
This tool is used to break down broad categories into finer and finer levels of detail. It can map levels of details of tasks that are required to accomplish a goal or solution or task. Developing the tree diagram helps one move their thinking from generalities to specifics." [Seven Management and Planning Tools. Wikipedia]
This root cause analysis tree diagram template for the ConceptDraw PRO diagramming and vector drawing software is included in the Seven Management and Planning Tools solution from the Management area of ConceptDraw Solution Park.
RCA diagram
Cause and Effect Analysis


HelpDesk
How To Create Root Cause Analysis Diagram Using ConceptDraw Office

PROBLEM ANALYSIS. Root Cause Analysis Tree Diagram

ConceptDraw Office suite is a software for problem analysis.
Root Cause Analysis

Analyze the root causes for factors that influenced the problem. This diagram is constructed separately for each highly prioritized factor. The goal of this is to find the root causes for the factor and list possible corrective action.
Affinity Diagram

Activity Network Diagram Method

This sample shows the PERT (Program Evaluation Review Technique) chart of the request on proposal. A request for proposal (RFP) is a request of the company or the organization to potential suppliers to submit the business proposals for service or goods that it is interested to purchase. The RFP is represented on the initial procurement stage and allows to define the risks and benefits.
Problem solving

These tools are exemplary at organizing research, parsing complex problems, providing a structure for the details, helping managers make decisions, and organizing effective communications in a visual manner that keeps everyone involved.
Decision Making

The Seven Management and Planning Tools is a set for such diagrams: Affinity Diagram, Relations Diagram, Prioritization Matrix, Root Cause Tree Diagram, Involvement Matrix, PERT Chart, Risk Diagram (PDPC).
Authority Matrix Diagram Software

ConceptDraw PRO extended with Seven Management and Planning Tools solution from the Management Area is the best Authority Matrix Diagram Software.
PDPC

 Management Area
The solutions from Management area of ConceptDraw Solution Park collect templates, samples and libraries of vector stencils for drawing the management diagrams and mind maps.
CORRECTIVE ACTIONS PLANNING. Risk Diagram (PDPC)
 - Health care")
- Root cause analysis tree diagram - Template | Fault Tree Analysis ...
- PROBLEM ANALYSIS. Root Cause Analysis Tree Diagram | Root ...
- PROBLEM ANALYSIS. Root Cause Analysis Tree Diagram | How To ...
- Manufacturing 8 Ms fishbone diagram - Template | Business ...
- Root cause analysis tree diagram - Template
- Fault Tree Analysis Diagrams | Root cause analysis tree diagram ...
- Fault Tree Analysis Diagrams | Root cause analysis tree diagram ...
- Root cause analysis tree diagram - Template
- Root cause analysis tree diagram template
- Cause and Effect Analysis | Root cause analysis tree diagram ...
- Root cause analysis tree diagram template | Cause & Effect Analysis ...
- Value-Stream Mapping for Manufacturing | Business Productivity ...
- PROBLEM ANALYSIS Root Cause Analysis Tree Diagram | Seven ...
- Root Cause Analysis tree diagram template | Cause & Effect ...
- Cause And Effect Of Manufacturing
- Root cause analysis tree diagram - Manufacturing problem solution ...
- Cause and Effect Analysis (Fishbone Diagrams ) | Cause and Effect ...
- PROBLEM ANALYSIS. Root Cause Analysis Tree Diagram ...
- Root Cause Analysis Mac
- Seven Management and Planning Tools | PROBLEM ANALYSIS ...