Rainfall Bar Chart

Export from ConceptDraw MINDMAP to PowerPoint® Presentation


to MS PowerPoint
Chart Software for Better Presentations

Financial Comparison Chart

Percentage Pie Chart. Pie Chart Examples

Geo Map - Africa - Somalia

Bar Chart Examples

Geo Map - Africa - Liberia

This DFD sample was created on the base of the figure from the NASA website. [asd-www.larc.nasa.gov/ ATBD/ DFD.html]
"Clouds and the Earth's Radiant Energy System (CERES).
EOS-Terra: Understanding Earth's Clouds and Climate.
The Clouds and the Earth's Radiant Energy System (CERES) instrument is one of several that will be flown aboard the Earth Observing System's Terra spacecraft, scheduled for launch in late1999. The data from the CERES instrument will be used to study the energy exchanged between the Sun; the Earth's atmosphere, surface and clouds; and outer space.
The CERES EOS-Terra instrument will be the second CERES instrument in Earth orbit. The first CERES instrument is currently orbiting the Earth aboard the Tropical Rainfall Measuring Mission observatory, which was launched in November 1997. Early results of the TRMM mission show that the first CERES has provided better measurement capabilities than any previous satellite instrument of its kind.
What CERES Will Measure.
CERES will measure the energy at the top of the atmosphere, as well as estimate energy levels in the atmosphere and at the Earth's surface. Using information from very high resolution cloud imaging instruments on the same spacecraft, CERES also will determine cloud properties, including cloud amount, altitude, thickness, and the size of the cloud particles. All of these measurements are critical for advancing our understanding of the Earth's total climate system and further improving climate prediction models.
The CERES instrument is based on NASA Langley's highly successful Earth Radiation Budget Experiment (ERBE) which used three satellites to provide global energy budget measurements from 1984 to 1990." [nasa.gov/ centers/ langley/ news/ factsheets/ CERES.html]
The DFD example "CERES data flow diagram" was created using the ConceptDraw PRO diagramming and vector drawing software extended with the Data Flow Diagrams solution from the Software Development area of ConceptDraw Solution Park.
DFD

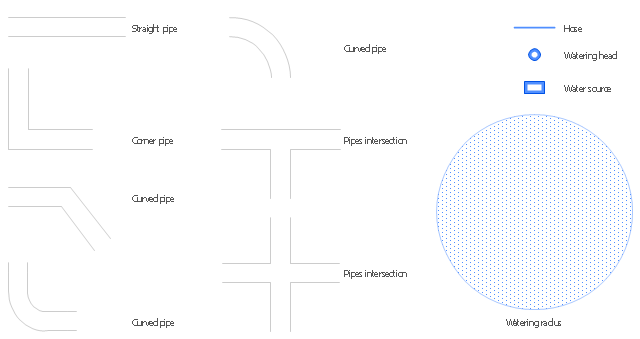
The vector stencils library "Plumbing" contains 11 shapes of straight, corner and curved pipes, pipes intersections, watering head, water source, watering radius, hose.
Use it to design garden plans with plants irrigation system layout.
"Irrigation is the artificial application of water to the land or soil. It is used to assist in the growing of agricultural crops, maintenance of landscapes, and revegetation of disturbed soils in dry areas and during periods of inadequate rainfall." [Irrigation. Wikipedia]
The garden watering shapes example "Design elements - Plumbing" was created using the ConceptDraw PRO diagramming and vector drawing software extended with the Landscape and Garden solution from the Building Plans area of ConceptDraw Solution Park.
Garden watering shapes
Column Chart Software

Bar Diagrams for Problem Solving. Create space science bar charts with Bar Graphs Solution

Pie Chart Word Template. Pie Chart Examples

Scatter Chart Examples

Sales Growth. Bar Graphs Example

- Rain Drawing On Chart
- Drawings About Rain
- Draw A Bargraph To Show Rainfall In Different Year
- Draw A Flow Chart On Rainy Season
- Rainfall Bar Chart | Chart Software for Better Presentations ...
- Rainfall Bar Chart | Chart Maker for Presentations | Bar Chart ...
- Basic Flowchart Images. Flowchart Examples | Rainfall Bar Chart ...
- Water cycle diagram | Drawing Illustration | Draw Flowcharts with ...
- Rainfall Bar Chart | Pie Graph Worksheets | Percentage Pie Chart ...
- Rainfall Bar Chart | Financial Comparison Chart | The Best ...
- Bar Graphs | Bar Diagram Math | Rainfall Bar Chart | Divided Simple ...
- Financial Comparison Chart | Sales Growth. Bar Graphs Example ...
- Draw Percentage Of Gases
- Drawing Of Histogram Barchart And Piechart
- Rainfall Bar Chart | Picture Graphs | Bar Graph | Image Of Block Graph
- Bar Graphs | Rainfall Bar Chart | Bar Chart | Simple Bar Graphs
- Rainfall Bar Chart | Bar Diagram Math | Bar Chart | Pictures Of A ...
- Financial Comparison Chart | Rainfall Bar Chart | Bar Graph | How ...
- Rainfall Bar Chart | Picture Graph | Bar Graph | Image Bar Graph
- Rainfall Bar Chart | Sales Growth. Bar Graphs Example | Chart ...