Rainfall Bar Chart

Nature Drawings - How to Draw
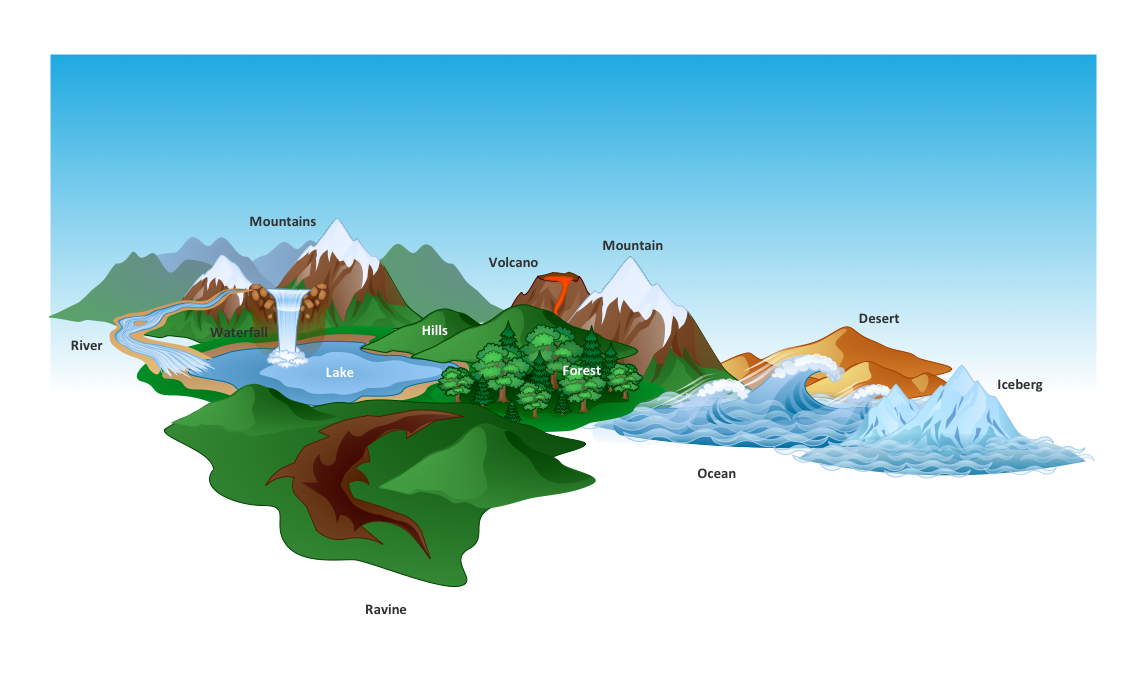
Drawing a Nature Scene

The vector stencils library "Weather" contains 17 weather clipart images for drawing illustrations on climate to show cloudiness, air temperature, precipitation, wind.
"Weather is the state of the atmosphere, to the degree that it is hot or cold, wet or dry, calm or stormy, clear or cloudy. Most weather phenomena occur in the troposphere, just below the stratosphere. Weather generally refers to day-to-day temperature and precipitation activity, whereas climate is the term for the average atmospheric conditions over longer periods of time. When used without qualification, "weather", is generally understood to mean the weather of Earth.
Weather is driven by air pressure (temperature and moisture) differences between one place and another. These pressure and temperature differences can occur due to the sun angle at any particular spot, which varies by latitude from the tropics. The strong temperature contrast between polar and tropical air gives rise to the jet stream. Weather systems in the mid-latitudes, such as extratropical cyclones, are caused by instabilities of the jet stream flow. Because the Earth's axis is tilted relative to its orbital plane, sunlight is incident at different angles at different times of the year. On Earth's surface, temperatures usually range ±40°C (−40°F to 100°F) annually. Over thousands of years, changes in Earth's orbit affect the amount and distribution of solar energy received by the Earth and influence long-term climate and global climate change." [Weather. Wikipedia]
The clip art example "Weather - Vector stencils library" was created using the ConceptDraw PRO diagramming and vector drawing software extended with the Nature solution from the Illustration area of ConceptDraw Solution Park.
www.conceptdraw.com/ solution-park/ illustrations-nature
Sunny

Cloudy

Overcast

Snow

Rain

Lightning

Hot

Warm

Frost

Mist

Strong wind

Flood

Tsunami

Dew

Hoar-frost

Earthquake

Snowflake

Drawing Illustration

Beautiful Nature Scene: Drawing
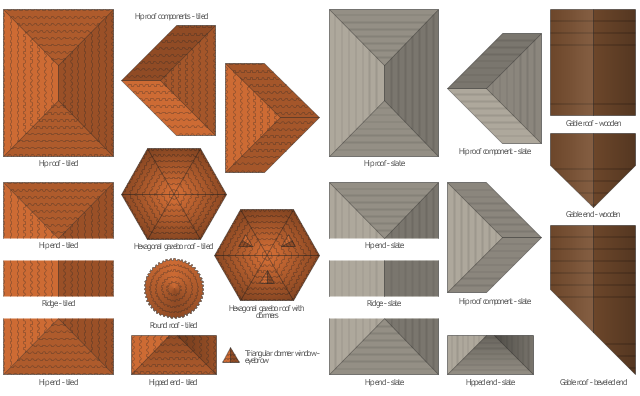
The vector stencils library "Roofs" contains 21 roof clipart images.
Use it to create your landscape design and garden plans.
"A roof of a building envelope, both the covering on the uppermost part of a building or shelter which provides protection from animals and weather, notably rain, but also heat, wind and sunlight; and the framing or structure which supports the covering. ...
In most countries a roof protects primarily against rain. A verandah may be roofed with material that protects against sunlight but admits the other elements. The roof of a garden conservatory, protects plants from cold, wind and rain but admits light.
A roof may also provide additional living space, for example a roof garden." [Roof. Wikipedia]
The clip art example "Design elements - Roofs" was created using the ConceptDraw PRO diagramming and vector drawing software extended with the Landscape & Garden solution from the Building Plans area of ConceptDraw Solution Park.
Roof clip art
Percentage Pie Chart. Pie Chart Examples

Basic Diagramming


Beauty in nature Illustrations and Clipart

How can you illustrate the weather condition

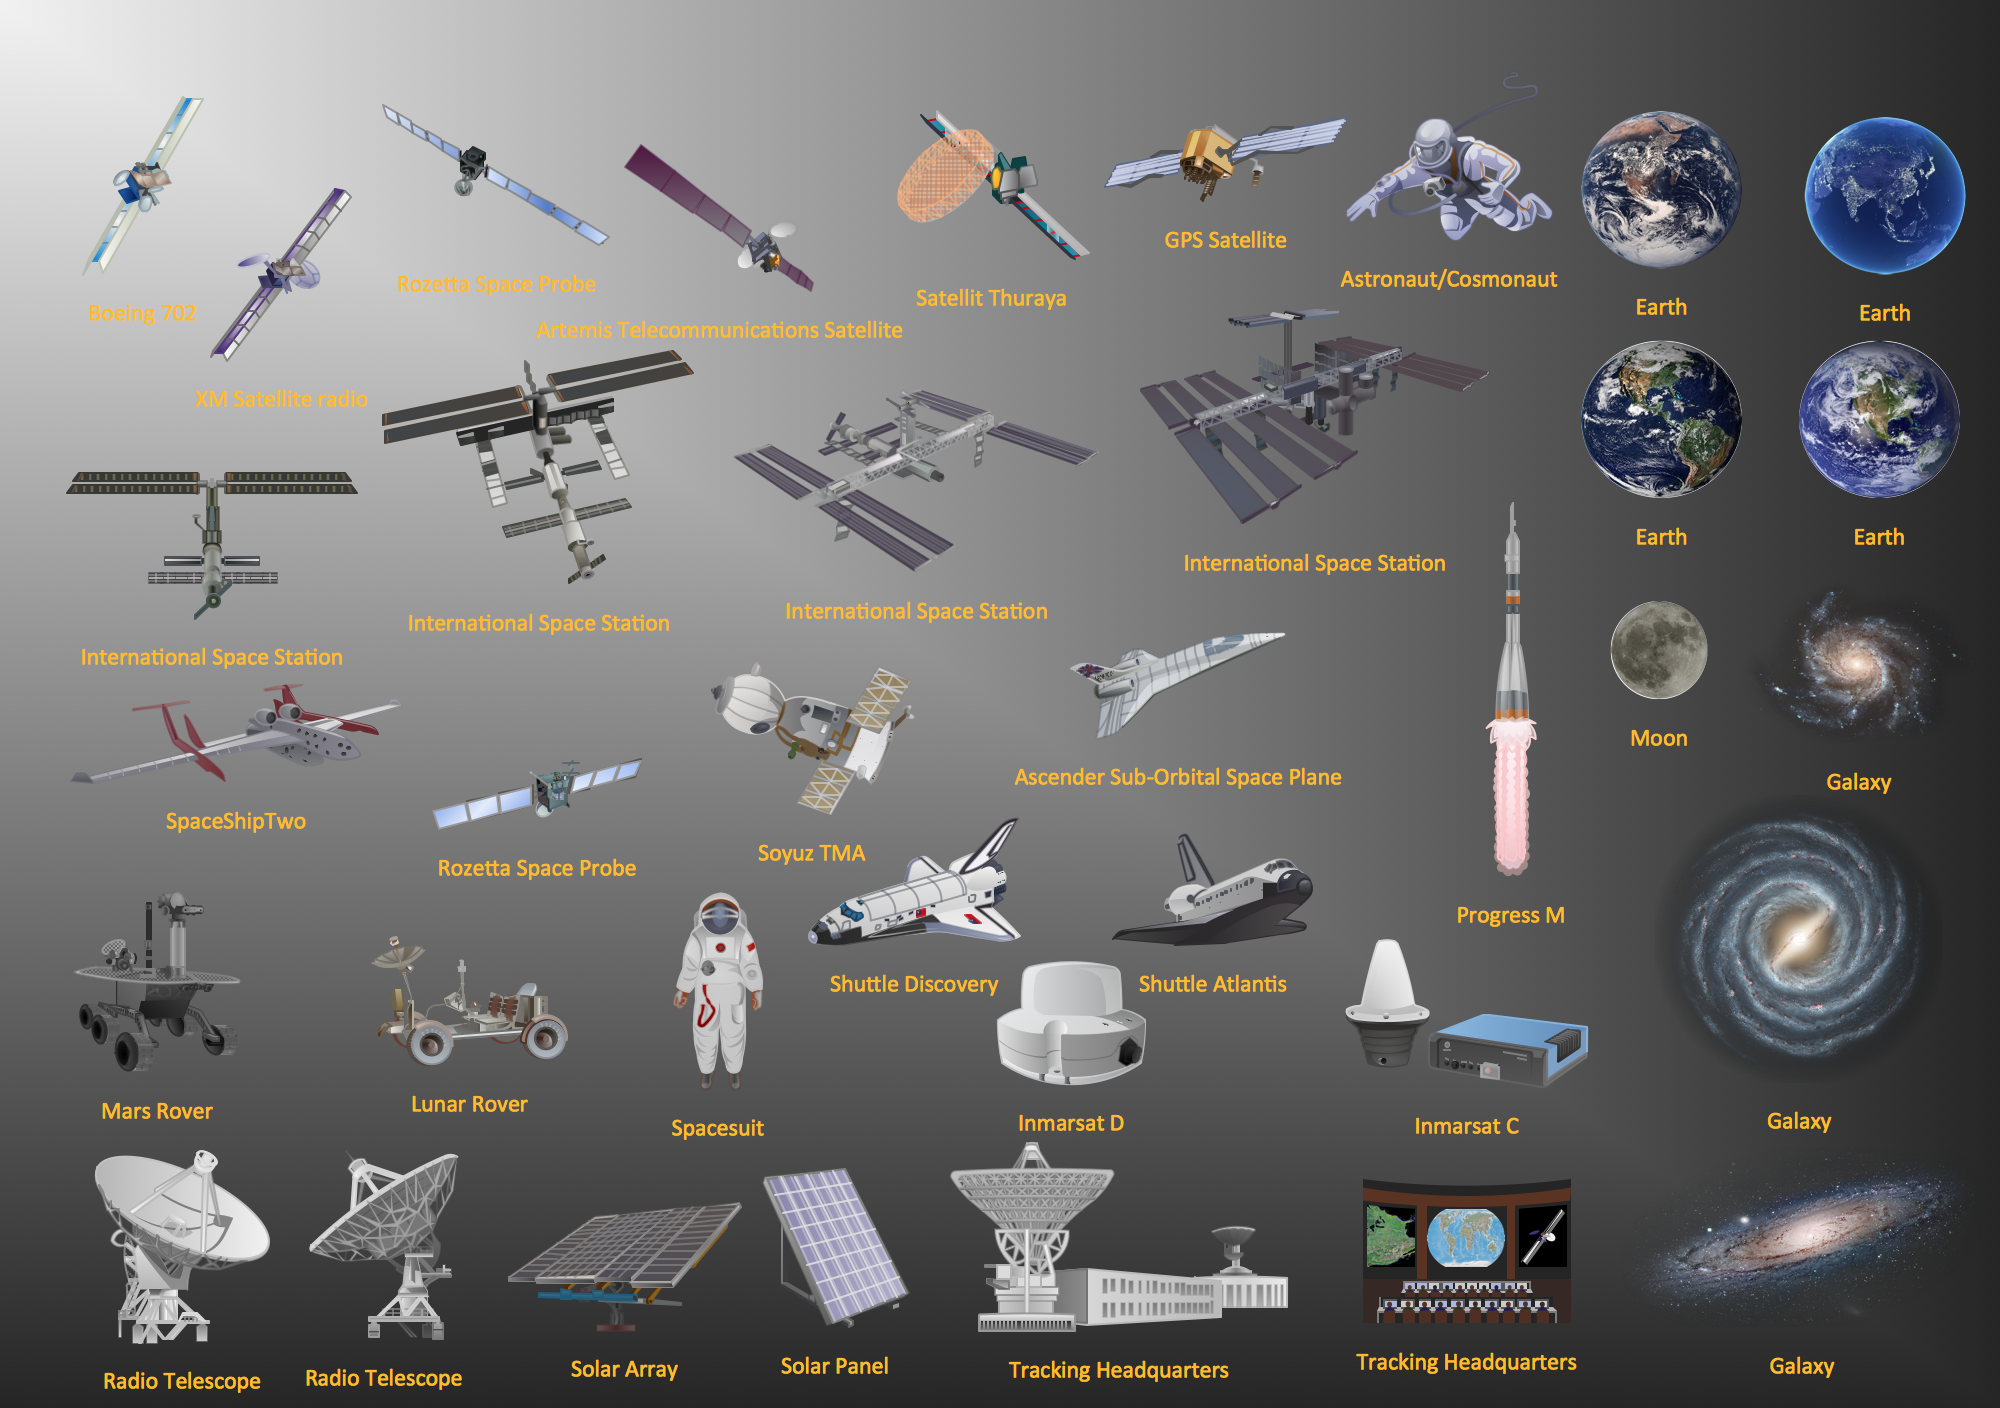
Aerospace - Design Elements
Restaurant Floor Plans Software

Draw Flowcharts with ConceptDraw

This work flow chart sample was redesigned from the picture "Weather Forecast" from the article "Simulation Workflows".
[iaas.uni-stuttgart.de/ forschung/ projects/ simtech/ sim-workflows.php]
"(1) The weather is predicted for a particular geological area. Hence, the workflow is fed with a model of the geophysical environment of ground, air and water for a requested area.
(2) Over a specified period of time (e.g. 6 hours) several different variables are measured and observed. Ground stations, ships, airplanes, weather balloons, satellites and buoys measure the air pressure, air/ water temperature, wind velocity, air humidity, vertical temperature profiles, cloud velocity, rain fall, and more.
(3) This data needs to be collected from the different sources and stored for later access.
(4) The collected data is analyzed and transformed into a common format (e.g. Fahrenheit to Celsius scale). The normalized values are used to create the current state of the atmosphere.
(5) Then, a numerical weather forecast is made based on mathematical-physical models (e.g. GFS - Global Forecast System, UKMO - United Kingdom MOdel, GME - global model of Deutscher Wetterdienst). The environmental area needs to be discretized beforehand using grid cells. The physical parameters measured in Step 2 are exposed in 3D space as timely function. This leads to a system of partial differential equations reflecting the physical relations that is solved numerically.
(6) The results of the numerical models are complemented with a statistical interpretation (e.g. with MOS - Model-Output-Statistics). That means the forecast result of the numerical models is compared to statistical weather data. Known forecast failures are corrected.
(7) The numerical post-processing is done with DMO (Direct Model Output): the numerical results are interpolated for specific geological locations.
(8) Additionally, a statistical post-processing step removes failures of measuring devices (e.g. using KALMAN filters).
(9) The statistical interpretation and the numerical results are then observed and interpreted by meteorologists based on their subjective experiences.
(10) Finally, the weather forecast is visualized and presented to interested people." [iaas.uni-stuttgart.de/ forschung/ projects/ simtech/ sim-workflows.php]
The example "Workflow diagram - Weather forecast" was drawn using the ConceptDraw PRO diagramming and vector drawing software extended with the Workflow Diagrams solution from the Business Processes area of ConceptDraw Solution Park.
Work flow chart

- Nature Drawings - How to Draw | All Drawing Acid Rain
- Nature Drawings - How to Draw | Acid Rain Eith Simple Diagram
- Nature Drawings - How to Draw | Acid Rain Flow Diagram
- Rainfall Bar Chart | Drawing Illustration | Draw Flowcharts with ...
- Biology Drawing Software | Illustration Software | Chemistry Drawing ...
- Drawing Of Acid Rain
- Water cycle diagram | Draw Flowcharts with ConceptDraw | Drawing ...
- Water cycle diagram | Drawing Illustration | Drawing a Nature ...
- Water cycle diagram | Draw Flowcharts with ConceptDraw | Drawing ...
- How can you illustrate the weather condition | Acid Rain Drawing
- Flow Diagram Of Acid Rain
- How can you illustrate the weather condition | Nature Drawings ...
- Rain Flow Drawing
- Draw A Flow Diagram Of Acid Rain
- How can you illustrate the weather condition | Nature Drawings ...
- Acid Rain Cycle Diagram
- Relief Rain Sketches
- Schematic Diagram Of Acid Rain Cycle
- Drawing a Nature Scene | Network Topology Illustration | Nature ...