TQM Diagram Tool

House of Quality Matrix Software

Probability Quality Control Tools

Management Tools — Total Quality Management

TQM Tools

Create TQM Flowcharts for Mac

Mind Map - Quality Structure

Fundamental Tool in Quality Management

Total Quality Management Value

Quality Improvement

TQM Diagram Example

Context Diagram Template

This template shows the Context Diagram. It was created in ConceptDraw PRO diagramming and vector drawing software using the Block Diagrams Solution from the “Diagrams” area of ConceptDraw Solution Park. The context diagram graphically identifies the system. external factors, and relations between them. It’s a high level view of the system. The context diagrams are widely used in software engineering and systems engineering for designing the systems that process the information.
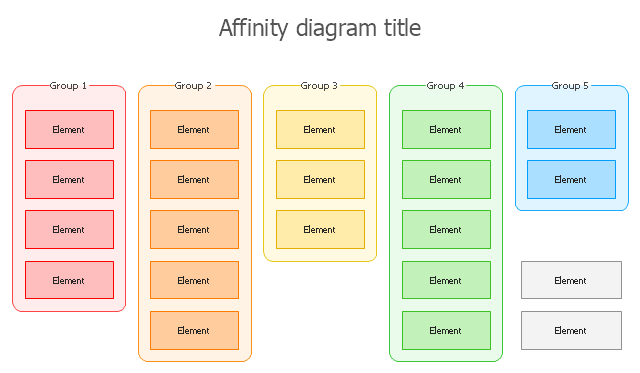
The affinity diagram shows the structure of complex factors that have an influence on a problem, and then divides them up into a smaller and simpler structure. This diagram is designed to prepare the data for further analysis of the cause-effect relationships.
"Affinity diagrams are a special kind of brainstorming tool that organize large amounts of disorganized data and information into groupings based on natural relationships.
It was created in the 1960s by the Japanese anthropologist Jiro Kawakita. Its also known as KJ diagram,after Jiro Kawakita.When to Use an Affinity Diagram: 1) When you are confronted with many facts or ideas in apparent chaos. 2) When issues seem too large and complex to grasp." [Seven Management and Planning Tools. Wikipedia]
The affinity diagram is one of the Seven Management and Planning Tools (7 MP tools, Seven New Quality Tools).
The affinity diagram template for the ConceptDraw PRO diagramming and vector drawing software is included in the solution "Seven Management and Planning Tools" from the Management area of ConceptDraw Solution Park.
Affinity diagram template
The PERT chart shows the logical connections and consequence of a set of tasks. PERT charts the time period for problem solving and the implementation plan for all activities along the critical path. The PERT chart is also known as a precedence diagram or project network diagram.
"The Program (or Project) Evaluation and Review Technique, commonly abbreviated PERT, is a statistical tool, used in project management, that is designed to analyze and represent the tasks involved in completing a given project. ...
PERT is a method to analyze the involved tasks in completing a given project, especially the time needed to complete each task, and to identify the minimum time needed to complete the total project.
PERT was developed primarily to simplify the planning and scheduling of large and complex projects. ...
A network diagram can be created by hand or by using diagram software. There are two types of network diagrams, activity on arrow (AOA) and activity on node (AON). Activity on node diagrams are generally easier to create and interpret." [Program Evaluation and Review Technique. Wikipedia]
The PERT chart is one of the Seven Management and Planning Tools (7 MP tools, Seven New Quality Tools).
The PERT chart template for the ConceptDraw PRO diagramming and vector drawing software is included in the solution "Seven Management and Planning Tools" from the Management area of ConceptDraw Solution Park.
PERT chart template

Legend

Quality Management Tools
-Diagram-in-SolutionBrowser.png "Quality Management Tools")
- Prioritization matrix - Template
- Total Quality Management TQM Diagrams | TQM diagram template ...
- Fishbone Diagram | Total Quality Management Value | Seven Basic ...
- Quality fishbone diagram - Template | Cause and Effect Diagrams ...
- Fundamental Tool in Quality Management | Seven Basic Tools of ...
- House of Quality Matrix Software
- Quality fishbone diagram - Template | TQM Diagram Tool | Total ...
- SWOT Matrix Template | Audio Visual Cables and Connectors ...
- How to Create a TQM Diagram Using Total Quality Management ...
- Context Diagram Template | Probability Quality Control Tools | ERD ...
- Person involvement matrix - Template | Organizational Structure ...
- PERT chart - Template | Program Evaluation and Review Technique ...
- Total Quality Management Value | TQM Diagram Tool | TQM ...
- House of Quality Matrix Software | Business Tools Perceptual ...
- Probability Quality Control Tools | Management Tools — Total ...
- Total Quality Management Value | Quality Mind Map | Probability ...
- Total Quality Management Template
- Seven Management and Planning Tools | Affinity diagram template ...
- Management Tools — Total Quality Management | Multi Layer Venn ...
- PROBLEM ANALYSIS. Prioritization Matrix | How To Create a ...