 Fishbone Diagrams
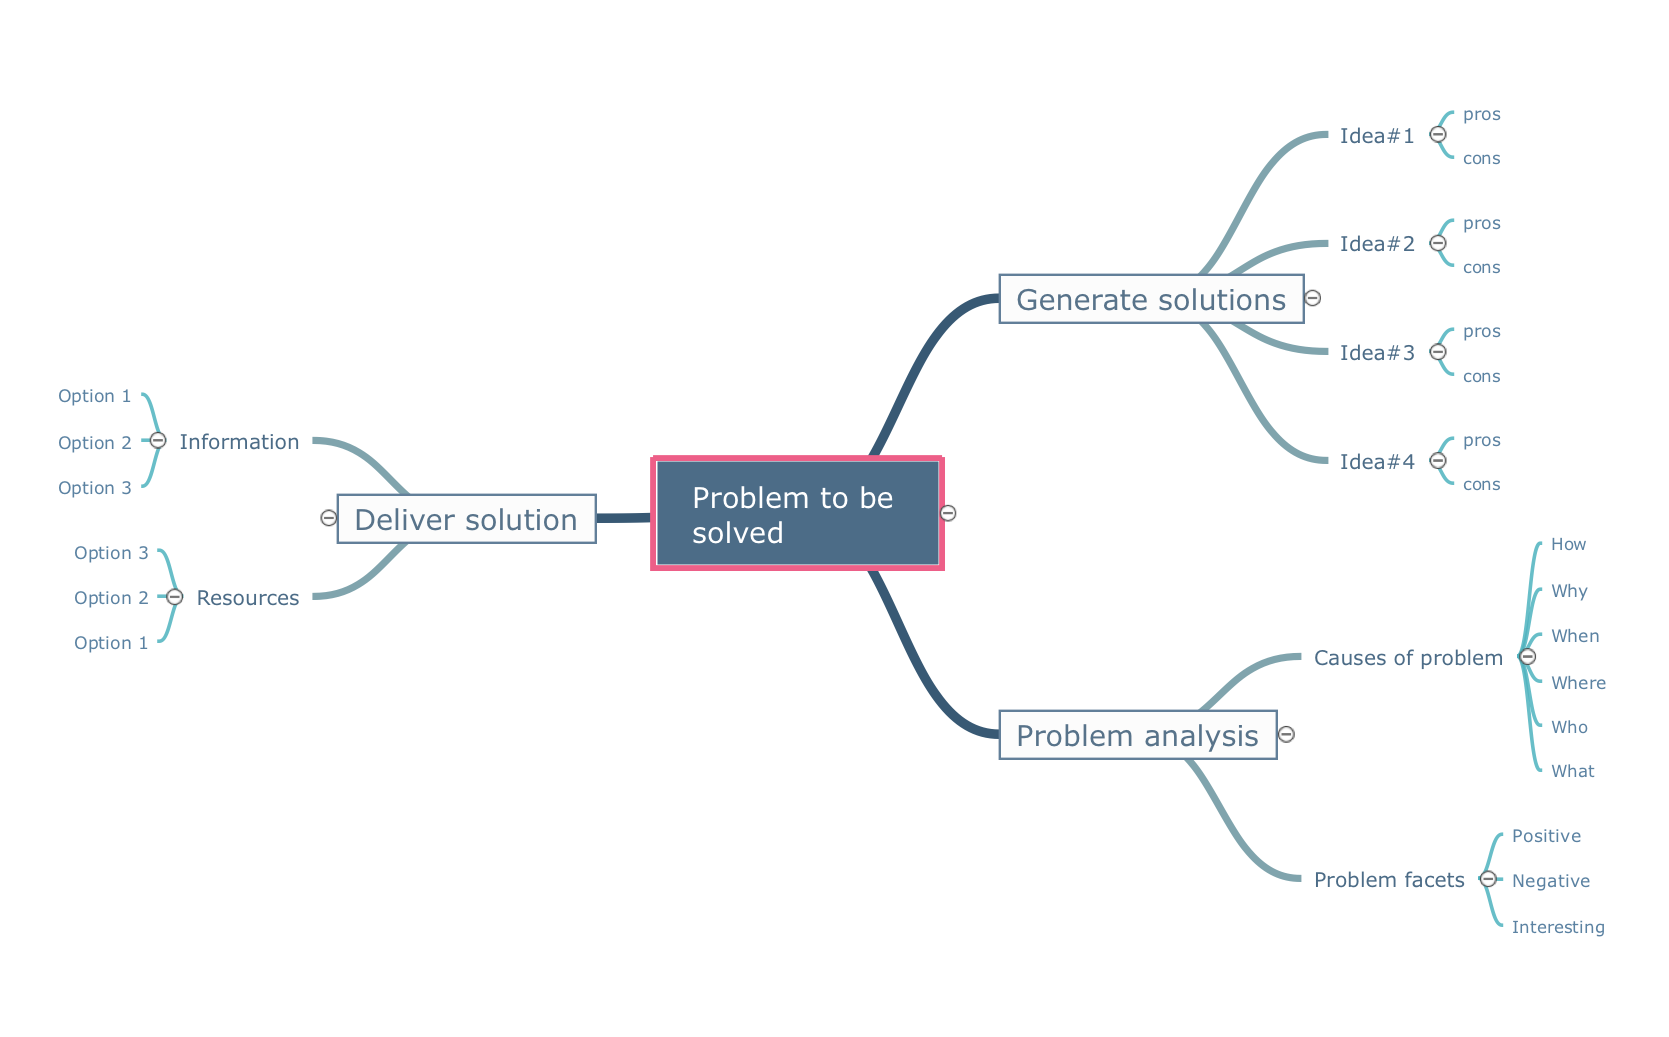
The Fishbone Diagrams solution extends ConceptDraw DIAGRAM software with the ability to easily draw the Fishbone Diagrams (Ishikawa Diagrams) to clearly see the cause and effect analysis and also problem solving. The vector graphic diagrams produced using this solution can be used in whitepapers, presentations, datasheets, posters, and published technical material.
 Fishbone Diagram
Fishbone Diagrams solution extends ConceptDraw DIAGRAM software with templates, samples and library of vector stencils for drawing the Ishikawa diagrams for cause and effect analysis.
 AWS Architecture Diagrams
AWS Architecture Diagrams with powerful drawing tools and numerous predesigned Amazon icons and AWS simple icons is the best for creation the AWS Architecture Diagrams, describing the use of Amazon Web Services or Amazon Cloud Services, their application for development and implementation the systems running on the AWS infrastructure. The multifarious samples give you the good understanding of AWS platform, its structure, services, resources and features, wide opportunities, advantages and benefits from their use; solution’s templates are essential and helpful when designing, description and implementing the AWS infrastructure-based systems. Use them in technical documentation, advertising and marketing materials, in specifications, presentation slides, whitepapers, datasheets, posters, etc.
A Creative Look at Quality Procedures
Pyramid Diagram

 ConceptDraw Solution Park
ConceptDraw Solution Park collects graphic extensions, examples and learning materials
 Pyramid Diagrams
Pyramid Diagrams solution extends ConceptDraw DIAGRAM software with templates, samples and library of vector stencils for drawing the marketing pyramid diagrams.
 Safety and Security
Safety and security solution extends ConceptDraw DIAGRAM software with illustration samples, templates and vector stencils libraries with clip art of fire safety, access and security equipment.
ERD Symbols and Meanings


Competitor Analysis

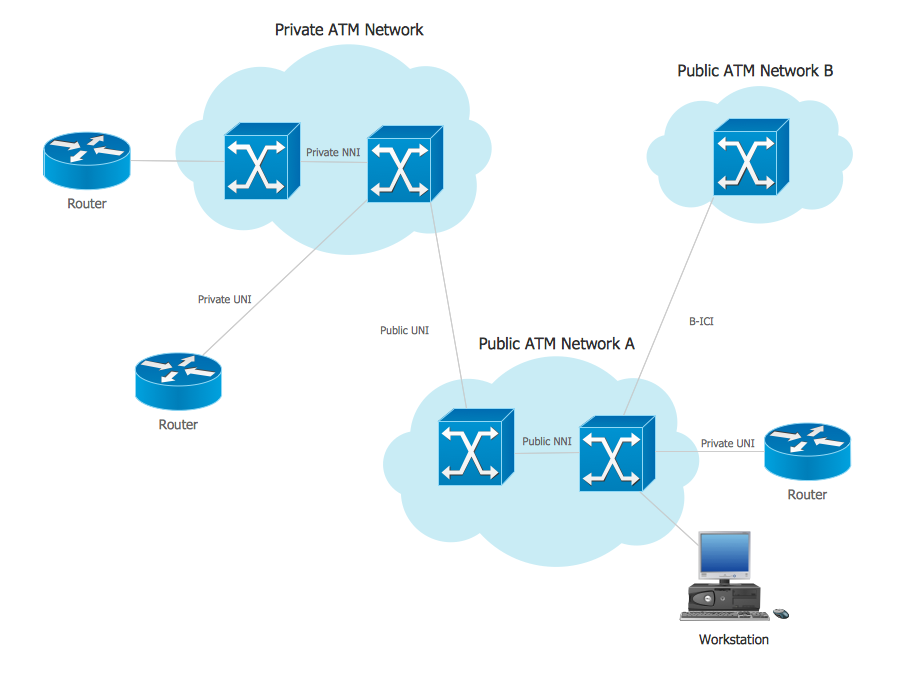
ATM Network. Computer and Network Examples

Data Modeling with Entity Relationship Diagram

Pyramid Diagram

 Block Diagrams
Block diagrams solution extends ConceptDraw DIAGRAM software with templates, samples and libraries of vector stencils for drawing the block diagrams.
 Entity-Relationship Diagram (ERD)
Entity-Relationship Diagram (ERD) solution extends ConceptDraw DIAGRAM software with templates, samples and libraries of vector stencils from drawing the ER-diagrams by Chen's and crow’s foot notations.
- Quality Poster Block Diagram
- Block Diagram Poster Mechanical Engineering
- ER Diagram for Cloud Computing | Introduction to Cloud Computing ...
- Fishbone Diagram Procedure | Total Quality Management Value ...
- Fishbone Diagrams | Total Quality Management with ConceptDraw ...
- Fishbone diagram - Causes of low- quality output | Fishbone ...
- Scatter Diagram In Total Quality Management
- Fishbone Diagrams | Fishbone diagram - Causes of low- quality ...
- Total Quality Management Business Diagram | Fishbone Diagrams ...
- Cause And Effect Diagram Poor Quality Education
- Total Quality Management Business Diagram | SWOT Analysis ...
- Block diagram - Gap model of service quality | Process Flowchart ...
- Fishbone Diagram | Fishbone Diagrams | Seven Basic Tools of ...
- Ishikawa Diagram Process
- Fishbone Diagram Of Poor Quality Product
- Total Quality Management TQM Diagrams | Definition TQM Diagram ...
- Fishbone Diagram | Fishbone Diagrams | Main Points Poor Of ...
- Total Quality Management with ConceptDraw | Educational ...
- Fishbone diagram - Causes of low- quality output | TQM Diagram ...
- Fishbone Diagrams | Total Quality Management Value | Fishbone ...