Basic Network Diagram


Process Flowchart


Basic Flowchart Symbols and Meaning


House of Quality Matrix Software

Swim Lane Diagrams

Total Quality Management Value

Simple Drawing Applications for Mac

"Dimensions of service quality.
A customer's expectation of a particular service is determined by factors such as recommendations, personal needs and past experiences. The expected service and the perceived service sometimes may not be equal, thus leaving a gap. The service quality model or the ‘GAP model’ developed by a group of authors- Parasuraman, Zeithaml and Berry at Texas and North Carolina in 1985 , highlights the main requirements for delivering high service quality. It identifies five ‘gaps’ that cause unsuccessful delivery. Customers generally have a tendency to compare the service they 'experience' with the service they 'expect' . If the experience does not match the expectation , there arises a gap. Ten determinants that may influence the appearance of a gap were described by Parasuraman, Zeithaml and Berry. in the SERVQUAL model: reliability, responsiveness, competence, access, courtesy, communication, credibility, security, understanding the customer and tangibles.
Later, the determinants were reduced to five: tangibles; reliability; responsiveness; service assurance and empathy in the so called RATER model." [Service quality. Wikipedia]
The block diagram example "Gap model of service quality" was created using the ConceptDraw PRO diagramming and vector drawing software extended with the Block Diagrams solution from the area "What is a Diagram" of ConceptDraw Solution Park.
Block diagram

Quality Management System

Draw Company Structure with Organization Charting Software

Draw Company Structure Diagram - get the detailed information about the company structure and hierarchy - who execute what tasks and who is in charge at this company. This information shows the reasoning and success of business and is indispensable for investors and financial institutions.
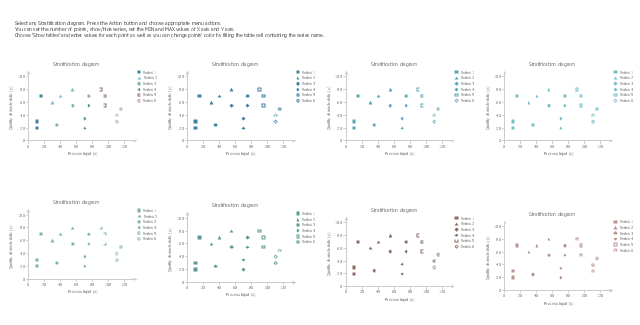
The vector stencils library "Stratification diagram" contains 8 multiseries scatterplot templates.
Use it to design your stratification diagrams with ConceptDraw PRO diagramming and vector drawing software.
"In statistics, stratified sampling is a method of sampling from a population.
In statistical surveys, when subpopulations within an overall population vary, it is advantageous to sample each subpopulation (stratum) independently. Stratification is the process of dividing members of the population into homogeneous subgroups before sampling. The strata should be mutually exclusive: every element in the population must be assigned to only one stratum. The strata should also be collectively exhaustive: no population element can be excluded. Then simple random sampling or systematic sampling is applied within each stratum. This often improves the representativeness of the sample by reducing sampling error. It can produce a weighted mean that has less variability than the arithmetic mean of a simple random sample of the population." [Stratified sampling. Wikipedia]
The stratification is one of the Seven Basic Tools of Quality. [Seven Basic Tools of Quality. Wikipedia]
The example of multiseries scatterplot templates "Design elements - Stratification diagram" is included in the Seven Basic Tools of Quality solution from the Quality area of ConceptDraw Solution Park.
Multiseries scatterplot templates
Network Gateway Router

TQM Tools

Types of Flowchart - Overview


Visual Presentations Made Easy with Diagramming Software


- Seven Basic Tools of Quality - Fishbone Diagram | Fishbone ...
- Fishbone Diagram | Seven Basic Tools of Quality - Fishbone ...
- Design elements - Stratification diagram | Seven Basic Tools of ...
- Seven Basic Tools of Quality - Fishbone Diagram | Seven Basic ...
- Basic Flowchart Symbols and Meaning | Basic Diagramming | Seven ...
- TQM Diagram Example | Probability Quality Control Tools | TQM ...
- Simple Cause And Effect Diagram Examples
- Pyramid Diagram | Simple & Fast Diagram Software | PM Response ...
- Manufacturing 8 Ms fishbone diagram - Template | Business ...
- Lean Manufacturing Diagrams | TQM Diagram Tool | Total Quality ...
- Basic Flowchart Symbols and Meaning | Total Quality Management ...
- Network Diagramming Software for Design Basic Network Diagrams ...
- How to Draw an Organization Chart | Simple & Fast Diagram ...
- Total Quality Management Value | Manufacturing 8 Ms fishbone ...
- Basic Diagramming | Total Quality Management TQM Diagrams ...
- Fishbone Diagram | Universal Diagramming Area | Simple & Fast ...
- Basic Flowchart Symbols and Meaning | Block Diagrams ...
- Business Productivity Diagramming | Ishikawa Diagram | Total ...
- Business Productivity Diagramming | Business Productivity ...