Timeline charts presents events and time periods on a chronological scale. They are used in project management to visualize project milestones and upper level phases, and show project progress.
"... timeline is used for project management. In these cases, timelines are used to help team members to know what milestones need to be achieved and under what time schedule. For example, in the case of establishing a project timeline in the implementation phase of the life cycle of a computer system." [Timeline. Wikipedia]
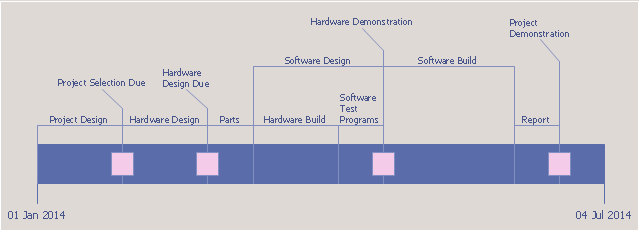
This project timeline diagram example was created using the ConceptDraw PRO diagramming and vector drawing software extended with the Timeline Diagrams solution from the Management area of ConceptDraw Solution Park.
"... timeline is used for project management. In these cases, timelines are used to help team members to know what milestones need to be achieved and under what time schedule. For example, in the case of establishing a project timeline in the implementation phase of the life cycle of a computer system." [Timeline. Wikipedia]
This project timeline diagram example was created using the ConceptDraw PRO diagramming and vector drawing software extended with the Timeline Diagrams solution from the Management area of ConceptDraw Solution Park.
Project timeline
 Timeline Diagrams
Timeline Diagrams solution extends ConceptDraw DIAGRAM diagramming software with samples, templates and libraries of specially developed smart vector design elements of timeline bars, time intervals, milestones, events, today marker, legend, and many other elements with custom properties, helpful for professional drawing clear and intuitive Timeline Diagrams. Use it to design simple Timeline Diagrams and designate only the main project stages, or highly detailed Timeline Diagrams depicting all project tasks, subtasks, milestones, deadlines, responsible persons and other description information, ideal for applying in presentations, reports, education materials, and other documentation.
"A project plan, according to the Project Management Body of Knowledge, is: "...a formal, approved document used to guide both project execution and project control. The primary uses of the project plan are to document planning assumptions and decisions, facilitate communication among stakeholders, and document approved scope, cost, and schedule baselines. A project plan may be summarized or detailed." ...
The objective of a project plan is to define the approach to be used by the Project team to deliver the intended project management scope of the project.
At a minimum, a project plan answers basic questions about the project:
Why? - What is the problem or value proposition addressed by the project? Why is it being sponsored?
What? - What is the work that will be performed on the project? What are the major products/ deliverables?
Who? - Who will be involved and what will be their responsibilities within the project? How will they be organized?
When? - What is the project timeline and when will particularly meaningful points, referred to as milestones, be complete?" [Project plan. Wikipedia]
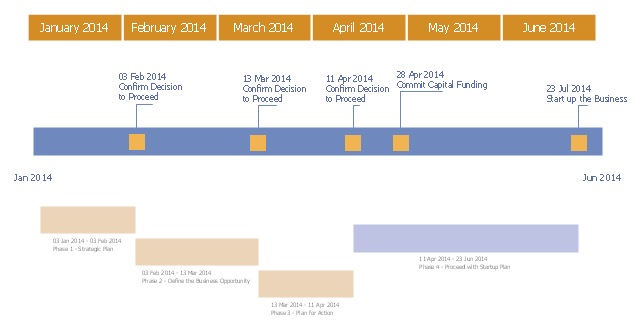
The timeline diagram example "New business project plan" was created using the ConceptDraw PRO diagramming and vector drawing software extended with the Timeline Diagrams solution from the Management area of ConceptDraw Solution Park.
The objective of a project plan is to define the approach to be used by the Project team to deliver the intended project management scope of the project.
At a minimum, a project plan answers basic questions about the project:
Why? - What is the problem or value proposition addressed by the project? Why is it being sponsored?
What? - What is the work that will be performed on the project? What are the major products/ deliverables?
Who? - Who will be involved and what will be their responsibilities within the project? How will they be organized?
When? - What is the project timeline and when will particularly meaningful points, referred to as milestones, be complete?" [Project plan. Wikipedia]
The timeline diagram example "New business project plan" was created using the ConceptDraw PRO diagramming and vector drawing software extended with the Timeline Diagrams solution from the Management area of ConceptDraw Solution Park.
Project timeline
The vector stencils library "Timelines and milestones" contains 24 shapes of time scales with start and finish dates, time interval bars with progress indication and brackets, milestone, event and today markers for drawing the timeline diagrams using the ConceptDraw PRO diagramming and vector drawing software.
"A timeline is a way of displaying a list of events in chronological order, sometimes described as a project artifact. It is typically a graphic design showing a long bar labelled with dates alongside itself and (usually) events labelled on points where they would have happened. ...
Another type of timeline is used for project management. In these cases, timelines are used to help team members to know what milestones need to be achieved and under what time schedule. For example, in the case of establishing a project timeline in the implementation phase of the life cycle of a computer system." [Timeline. Wikipedia]
The example "Design elements - Timelines solution" is included in the Timeline Diagrams solution from the Management area of ConceptDraw Solution Park.
Timeline and milestone symbols

"The RFP presents preliminary requirements for the commodity or service, and may dictate to varying degrees the exact structure and format of the supplier's response. Effective RFPs typically reflect the strategy and short/ long-term business objectives, providing detailed insight upon which suppliers will be able to offer a matching perspective. ...
RFP:
(1) informs suppliers that an organization is looking to procure and encourages them to make their best effort.
(2) requires the company to specify what it proposes to purchase. If the requirements analysis has been prepared properly, it can be incorporated quite easily into the Request document.
(3) alerts suppliers that the selection process is competitive.
(4) allows for wide distribution and response.
(5) ensures that suppliers respond factually to the identified requirements.
(6) is generally expected to follow a structured evaluation and selection procedure, so that an organization can demonstrate impartiality - a crucial factor in public sector procurements." [Request for proposal. Wikipedia]
The project plan timeline diagram example "Request for proposal (RFP)" was created using the ConceptDraw PRO diagramming and vector drawing software extended with the Timeline Diagrams solution from the Management area of ConceptDraw Solution Park.
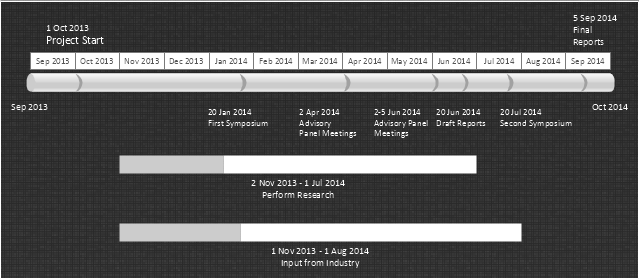
Project timeline
.png--diagram-flowchart-example.png)
"In project management, a schedule is a listing of a project's milestones, activities, and deliverables, usually with intended start and finish dates. Those items are often estimated in terms of resource allocation, budget and duration, linked by dependencies and scheduled events. A schedule is commonly used in project planning and project portfolio management parts of project management. Elements on a schedule may be closely related to the Work Breakdown Structure (WBS) terminal elements, the Statement of work, or a Contract Data Requirements List." [Schedule (project management). Wikipedia]
The timeline diagram example "Project schedule" was created using the ConceptDraw PRO diagramming and vector drawing software extended with the Timeline Diagrams solution from the Management area of ConceptDraw Solution Park.
The timeline diagram example "Project schedule" was created using the ConceptDraw PRO diagramming and vector drawing software extended with the Timeline Diagrams solution from the Management area of ConceptDraw Solution Park.
Project schedule
Examples of Flowcharts, Org Charts and More


Business diagrams & Org Charts with ConceptDraw DIAGRAM


Communication Tool for Remote Project Management

 PM Presentations
The PM Presentations solution extends the power of ConceptDraw MINDMAP , ConceptDraw DIAGRAM , and ConceptDraw PROJECT, improving their efficiency at many stages of the project management process by using the same source data to construct the targeted presentation for your audience and clearly communicating the appropriate information to different audiences from a single source. It gives an ability to project managers and other team participants to create and to deliver capacious presentations representing the data and knowledge of a specific project with the help of including visual dashboards, Gantt charts, resource views, maps, timelines, calendars, illustrations, project diagrams and reports of varied types. Having the possibility to edit collaboratively in a Full-Screen Mode, the teams can rapidly plan a project as well as execute the tasks of revising and making changes to it.
Gantt Chart Software

How to Report Task's Execution with Gantt Chart

How to Create Gantt Chart

 Business Processes
Business Process solution extends ConceptDraw DIAGRAM software with business process diagrams as cross-functional flowcharts, workflows, process charts, IDEF0, timelines, calendars, Gantt charts, business process modeling, audit and opportunity flowcharts.
Software Diagrams

 Seven Management and Planning Tools
Seven Management and Planning Tools solution extends ConceptDraw DIAGRAM and ConceptDraw MINDMAP with features, templates, samples and libraries of vector stencils for drawing management mind maps and diagrams.
ConceptDraw DIAGRAM The best Business Drawing Software

Activity Network (PERT) Chart

- Timeline Diagrams | Timeline diagram template | Project timeline ...
- Project timeline diagram - New business project plan | Timeline ...
- Project timeline diagram
- Timeline Diagrams | Timeline diagram template | Project timeline ...
- Project timeline diagram - New business project plan ...
- Project timeline diagram | Design elements - Timelines solution ...
- Business Processes | Timeline Diagrams | Business diagrams & Org ...
- Project timeline diagram - Conceptdraw.com
- Timeline Diagrams | Project Assigning Resources | Project ...
- Project timeline diagram
- Examples of Flowcharts, Org Charts and More | Project timeline ...
- Project timeline - Request for proposal plan | PERT chart - Request ...
- Timeline template | Examples of Flowcharts, Org Charts and More ...
- Value stream map example | Timeline Diagrams | Communication ...
- Timeline Diagrams | Project timeline diagram | Timeline diagram |
- Timeline diagram template | Timeline diagram | Project timeline ...
- Timeline Diagrams | Communication Tool for Remote Project ...
- Design elements - Timelines solution | Timeline diagram template ...
- Timeline diagram - Project schedule
- Timeline template | Timeline template | Business diagrams & Org ...