This site uses cookies. By continuing to browse the ConceptDraw site you are agreeing to our Use of Site Cookies.
HelpDesk

How to Draw a Gantt Chart

A Gantt chart is intended to provide a visualization of a project schedule. It is developed to help planning, coordinating, and tracking on project tasks implementation. One of the most critical resources for project implementation is a time resource. Gantt chart - is one of the most convenient and popular ways of graphical representation of project tasks progress in conjunction with the corresponding time consumption. Gantt chart's function is to show project tasks completed in a progress and to make a project manager sure that project tasks were completed on time. ConceptDraw OFFICE is a clear and easy-to-use tool for project management. It is a very handy visual tool that helps make a project processing clear.

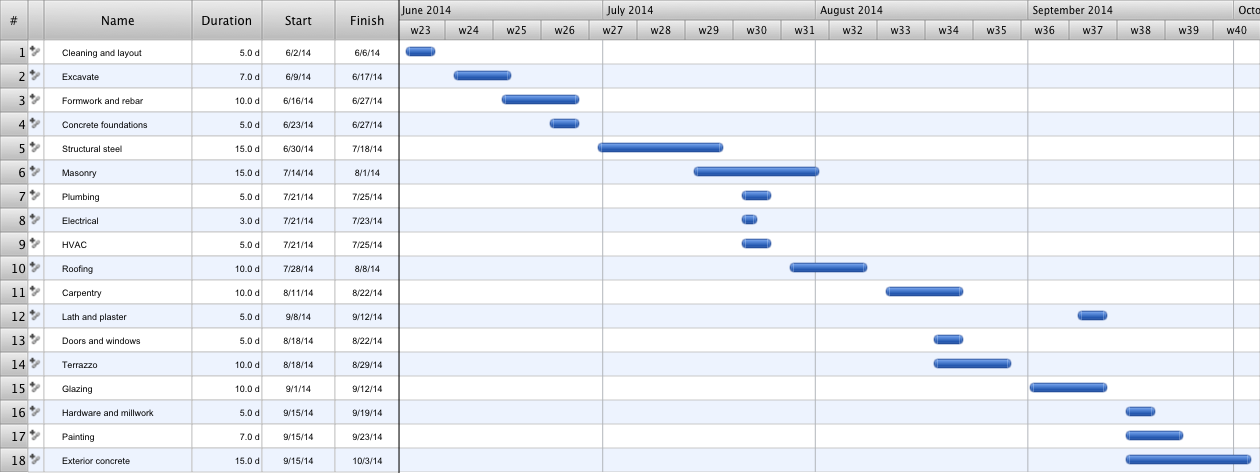
Construction Project Chart Examples

ConceptDraw PROJECT provides a set of construction Gantt chart examples. Project manager requires task tracking, and project examples best approach to start. Make your project applying one of our ready-made examples.

Pyramid Diagram

Those triangles within any technical analysis are known to be the chart patterns that can be commonly found in the price charts of the financially traded assets, such as stocks, futures, bonds, etc. The pattern is known to be deriving its name from the fact that it is characterized by some contraction in a price range being the converged trend lines, giving it a triangular shape.

How to Create Presentation of Your Project Gantt Chart

During the planning, discussing and execution of a project you may need to prepare a presentation using project views such as the Gantt Chart, Multiproject Dashboard or Resource Usage View. It’s easy do with ConceptDraw PROJECT!
HelpDesk

How to Create a Gantt Chart for Your Project

Instruction on how to create Gantt chart using ConceptDraw PROJECT software.
Gant Chart is a graphical representation of tasks as segments on a time scale. It helps plan or overlapping.

Gant Chart in Project Management

Gant Chart is a graphical representation of tasks as segments on a time scale. It helps plan and monitor project development or resource allocation. The horizontal axis is a time scale, expressed either in absolute or relative time.
what is software project management

How to Report Task's Execution with Gantt Chart

ConceptDraw PROJECT’s powerful reporting engine lets you generate a set of tabular reports with just one click, or visualize your project as Radial Tasks Structures, Work Breakdown Structures and Resource Calendars. It also provides you with dynamic Project Dashboards.
HelpDesk

How To Create a PERT Chart Using PM Easy Solution

Project Evaluation and Review Technique (PERT) is a method of project tasks evaluation and analysis. PERT - is a method of analyzing the tasks required to complete the project. It includes analysis of the time required to complete each task, as well as the determination of the time required to carry out the whole project. PERT was developed to facilitate the planning of huge and complex projects. PERT is used for very large, complex, and non-standard projects. Technology implies the presence of uncertainty, making it possible to develop a schedule of the project without precise information on details and time required for all of its components. The most popular part of PERT is a method of the critical path, based on the construction of the network schedule (PERT network diagram). ConceptDraw Office delivers you the best way to create PERT chart for your project using compatibility between ConceptDraw PROJECT and ConceptDraw DIAGRAM.

How to Discover Critical Path on a Gantt Chart

ConceptDraw PROJECT is the Gantt chart software that implements critical path method to provide the user with a wide set of project management tools.

How to Create Gantt Chart

To begin managing a new project, you will need to define the individual Tasks that must be completed to deliver it. The default view for a new project in ConceptDraw PROJECT is the Gantt Chart.