Process Flowchart


Basic Flowchart Symbols and Meaning


Business Process Elements: Activities
")

 Interactive Voice Response Diagrams
Interactive Voice Response Diagrams solution extends ConceptDraw PRO v10 software with samples, templates and libraries of ready-to-use vector stencils that help create Interactive Voice Response (IVR) diagrams illustrating in details a work of interactive voice response system, the IVR system’s logical and physical structure, Voice-over-Internet Protocol (VoIP) diagrams, and Action VoIP diagrams with representing voice actions on them, to visualize how the computers interact with callers through voice recognition and dual-tone multi-frequency signaling (DTMF) keypad inputs.
BPR Diagram. Business Process Reengineering Example

Bubble diagrams in Landscape Design with ConceptDraw PRO

Bubble diagrams with ConceptDraw PRO

IDEF4 Standard

How to do presentation of Mind Maps via Skype conference call?

Workflow Diagram Software Mac

HelpDesk
How to Make a Workflow Diagram Using ConceptDraw PRO

HelpDesk
How to Create a SIPOC Diagram

This IDEF3 diagram example was redesigned from the Wikimedia Commons file: 2-02 Example of a Transition Schematic.jpg.
[commons.wikimedia.org/ wiki/ File:2-02_ Example_ of_ a_ Transition_ Schematic.jpg]
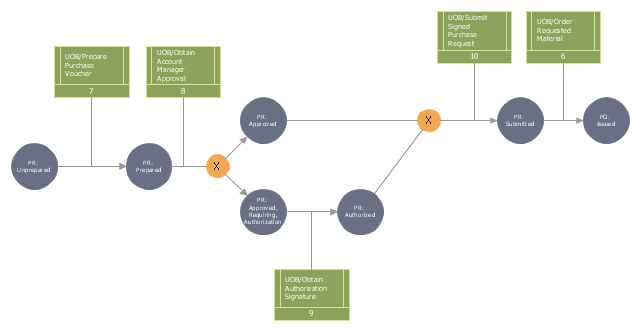
"The schematic in Figure 2-2 represents an Object Schematic for the Order Material scenario derived from the business owner’s description. This example happens to illustrate a Transition Schematic since it characterizes the nature and structure of object state transitions for occurrences of the Order Material scenario. A key document in this process is the Purchase Request form. This form is eventually transformed into a Purchase Order (PO) via the Order Material process. A circle containing the name of an object represents an object of a certain kind (e.g., Purchase Request, Account Manager, Project). These labeled circles are known as kind symbols. A certain kind of object being in a certain state is represented by a circle with a label that captures both the kind itself and a corresponding state, thereby representing the type (or class) of objects that are in that state (within a given process). ... One of the first steps to develop an Object Schematic is to identify the possible states in which the object can exist. Though a real-world object often evolves through a continuum of states, an Object Schematic focuses on those distinguished states of particular interest to the domain expert. The transition arcs (arrows with triangular, filled-in heads) connecting the circles symbolize a state transition, the activity of changing from one state to another. The conditions that establish when an object is in a given state, how it exists a state, how it can transition between states, and how it can enter a new state are recorded on a special form. The banded boxes linked to the arrows (called referents) are aids to describe the relationships between objects states and UOBs, scenarios, or other Transition Schematics that participate in a scenario occurrence. ... The transition junctions containing an “X” (for exclusive or) indicate the choice of exactly one path among several possible paths in an occurrence." [IDEF3 Process Description Capture Method Report AL-TR-1995-XXXX. idef.com/ pdf/ Idef3_ fn.pdf]
The diagram "Transition schematic - IDEF3 diagram example" was created using the ConceptDraw PRO diagramming and vector drawing software extended with the solution "IDEF Business Process Diagrams" from the area "Business Processes" of ConceptDraw Solution Park.
[commons.wikimedia.org/ wiki/ File:2-02_ Example_ of_ a_ Transition_ Schematic.jpg]
"The schematic in Figure 2-2 represents an Object Schematic for the Order Material scenario derived from the business owner’s description. This example happens to illustrate a Transition Schematic since it characterizes the nature and structure of object state transitions for occurrences of the Order Material scenario. A key document in this process is the Purchase Request form. This form is eventually transformed into a Purchase Order (PO) via the Order Material process. A circle containing the name of an object represents an object of a certain kind (e.g., Purchase Request, Account Manager, Project). These labeled circles are known as kind symbols. A certain kind of object being in a certain state is represented by a circle with a label that captures both the kind itself and a corresponding state, thereby representing the type (or class) of objects that are in that state (within a given process). ... One of the first steps to develop an Object Schematic is to identify the possible states in which the object can exist. Though a real-world object often evolves through a continuum of states, an Object Schematic focuses on those distinguished states of particular interest to the domain expert. The transition arcs (arrows with triangular, filled-in heads) connecting the circles symbolize a state transition, the activity of changing from one state to another. The conditions that establish when an object is in a given state, how it exists a state, how it can transition between states, and how it can enter a new state are recorded on a special form. The banded boxes linked to the arrows (called referents) are aids to describe the relationships between objects states and UOBs, scenarios, or other Transition Schematics that participate in a scenario occurrence. ... The transition junctions containing an “X” (for exclusive or) indicate the choice of exactly one path among several possible paths in an occurrence." [IDEF3 Process Description Capture Method Report AL-TR-1995-XXXX. idef.com/ pdf/ Idef3_ fn.pdf]
The diagram "Transition schematic - IDEF3 diagram example" was created using the ConceptDraw PRO diagramming and vector drawing software extended with the solution "IDEF Business Process Diagrams" from the area "Business Processes" of ConceptDraw Solution Park.
IDEF3 business process diagram
 Telecommunication Network Diagrams
Telecommunication Network Diagrams solution extends ConceptDraw PRO software with samples, templates, and great collection of vector stencils to help the specialists in a field of networks and telecommunications, as well as other users to create Computer systems networking and Telecommunication network diagrams for various fields, to organize the work of call centers, to design the GPRS networks and GPS navigational systems, mobile, satellite and hybrid communication networks, to construct the mobile TV networks and wireless broadband networks.
Settlement Process Flowchart. Flowchart Examples

- Process Flowchart | Summary Diagram Of A Phone Call Process
- Flow Chart Diagram Of A Company From Call Center Industry Using
- Call System Flow Diagram For Online Shopping
- Process Flow Chart For A Service Call
- Call Centre Flowchart
- Call Center Process Flow Diagram
- Call center network diagram | Star Network Topology ...
- Process Flowchart - Draw Process Flow Diagrams by Starting with ...
- Bubble diagrams with ConceptDraw PRO | Process Flowchart ...
- Telecommunication Network Diagrams | Process Flowchart ...
- Interactive Voice Response Diagrams | Seating Plans | Process ...
- Process Flowchart | Flow Diagram Of Steps Required To Connect A ...
- Call Center Process Flow Chart
- Process Flowchart | Basic Flowchart Symbols and Meaning | Call ...
- Store reporting flowchart | Interactive Voice Response Diagrams ...
- Call center network diagram | Standard Flowchart Symbols and ...
- Cross-Functional Flowchart (Swim Lanes) | Swim Lane Flowchart ...
- Call Step Procedure With The Help Of Diagram
- Flowchart For Call Center Process
- Trouble ticket system - BPMN 2.0 diagram | Business Process ...