HelpDesk
How to Draw a Divided Bar Chart in ConceptDraw PRO

Basic Flowchart Symbols and Meaning


Relative Value Chart Software

 Flowcharts
The Flowcharts solution for ConceptDraw PRO is a comprehensive set of examples and samples in several varied color themes for professionals that need to represent graphically a process. Solution value is added by the basic flow chart template and shapes' libraries of flowchart notation. ConceptDraw PRO flow chart creator lets one depict the processes of any complexity and length, as well as design the Flowchart either vertically or horizontally.
IDEF0 standard with ConceptDraw PRO

Process Diagrams

Competitor Analysis

 Business Process Diagrams
Business Process Diagrams solution extends the ConceptDraw PRO BPM software with RapidDraw interface, templates, samples and numerous libraries based on the BPMN 1.2 and BPMN 2.0 standards, which give you the possibility to visualize equally easy simple and complex processes, to design business models, to quickly develop and document in details any business processes on the stages of project’s planning and implementation.
Types of Flowcharts


Organizational Charts with ConceptDraw PRO

Swim Lane Diagrams

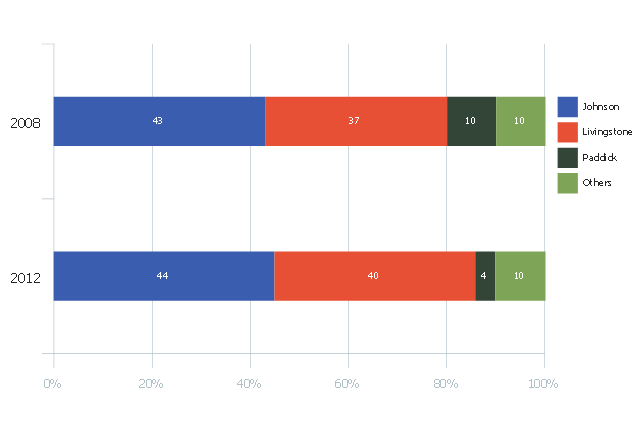
This divided bar diagram sample shows London election results in 2008 and 2012. It was drawn using data from the infographics "London Elections Results by Numbers" on the london.gov.uk website.
[data.london.gov.uk/ datastore/ package/ london-elections-results-2012-wards-boroughs-constituency]
"There are six types of elections in the United Kingdom: United Kingdom general elections, elections to devolved parliaments and assemblies, elections to the European Parliament, local elections, mayoral elections and Police and Crime Commissioner elections. Elections are held on Election Day, which is conventionally a Thursday. General elections do not have fixed dates, but must be called within five years of the opening of parliament following the last election. Other elections are held on fixed dates, though in the case of the devolved assemblies and parliaments early elections can occur in certain situations. Currently, six electoral systems are used: the single member plurality system (First Past the Post), the multi member plurality system, party list PR, the single transferable vote, the Additional Member System and the Supplementary Vote.
Elections are administered locally: in each lower-tier local authority, the actual polling procedure is run by the Returning Officer and the compiling and maintenance of the electoral roll by the Electoral Registration Officer (except in Northern Ireland, where the Electoral Office for Northern Ireland assumes both responsibilities). The Electoral Commission only sets standards for and issues guidelines to Returning Officers and Electoral Registration Officers, but is responsible for nationwide electoral administration (such as the registration of political parties and directing the administration of national referendums)." [Elections in the United Kingdom. Wikipedia]
The chart example "London election results" was created using the ConceptDraw PRO diagramming and vector drawing software extended with the Divided Bar Diagrams solution from the Graphs and Charts area of ConceptDraw Solution Park.
Divided bar chart
 Business Process Mapping
The Business Process Mapping solution for ConceptDraw PRO is for users involved in process mapping and creating SIPOC diagrams.
Chart Software for Better Presentations

Best Program to Make Flow Chart Diagrams

- How To Draw A Divided Rectangle In Geography
- Using A Divided Rectangle To Represent Data
- Steps Used To Draw Divided Rectangle
- Procedures Steps By Steps Of Drawing Divided Rectangle
- How To Draw A Divided Rectangle
- Representing Data On Divided Rectangle
- How to Draw a Divided Bar Chart in ConceptDraw PRO | Basic ...
- What Is Called Divided Rectangle Diagram
- Divided Rectangle Is Drawn In Graph
- How to Draw a Divided Bar Chart in ConceptDraw PRO | Basic ...
- Divided Rectangle Diagram On Graph
- The Procedure In Drawing Divided Bar Graphs
- Advantages Of Divided Rectangular To Represent Data
- Basic Flowchart Symbols and Meaning | How to Draw a Divided Bar ...
- Advantage Of Using Divided Rectangle To Represent Data
- How to Draw a Divided Bar Chart in ConceptDraw PRO | Process ...
- Divided Rectangular Diagram Definition And Steps Of Construction
- Divided Bar Diagrams | Relative Value Chart Software | Graphs and ...
- Divided Bar Diagrams
- Divided Bar Diagrams | Basic Diagramming | Design elements ...