Fault Tree Analysis Software

First of all, Fault Tree Analysis Diagrams Solution provides a set of samples which are the good examples of easy drawing professional looking Fault Tree Analysis Diagrams.
 Fault Tree Analysis Diagrams
This solution extends ConceptDraw PRO v9.5 or later with templates, fault tree analysis example, samples and a library of vector design elements for drawing FTA diagrams (or negative analytical trees), cause and effect diagrams and fault tree diagrams.
This example was redesigned from the Wikimedia Commons file: Example of High Level Fault Tree.jpg. [commons.wikimedia.org/ wiki/ File:Example_ of_ High_ Level_ Fault_ Tree.jpg]
"Risk assessment is the determination of quantitative or qualitative value of risk related to a concrete situation and a recognized threat (also called hazard). Quantitative risk assessment requires calculations of two components of risk (R):, the magnitude of the potential loss (L), and the probability (p) that the loss will occur. Acceptable risk is a risk that is understood and tolerated usually because the cost or difficulty of implementing an effective countermeasure for the associated vulnerability exceeds the expectation of loss.
In all types of engineering of complex systems sophisticated risk assessments are often made within Safety engineering and Reliability engineering when it concerns threats to life, environment or machine functioning. The nuclear, aerospace, oil, rail and military industries have a long history of dealing with risk assessment. Also, medical, hospital, social service and food industries control risks and perform risk assessments on a continual basis. Methods for assessment of risk may differ between industries and whether it pertains to general financial decisions or environmental, ecological, or public health risk assessment." [Risk assessment. Wikipedia]
The FTA diagram example "High level fault tree" was created using the ConceptDraw PRO diagramming and vector drawing software extended with the Fault Tree Analysis Diagrams solution from the Engineering area of ConceptDraw Solution Park.
FTA diagram

HelpDesk
How to Create a Fault Tree Analysis Diagram (FTD) in ConceptDraw PRO

Venn Diagrams

ConceptDraw PRO diagramming and vector drawing software extended with Venn Diagrams solution from "What is a Diagram" area offers set of useful drawing tools for easy creating the Venn Diagrams for any quantity of sets.
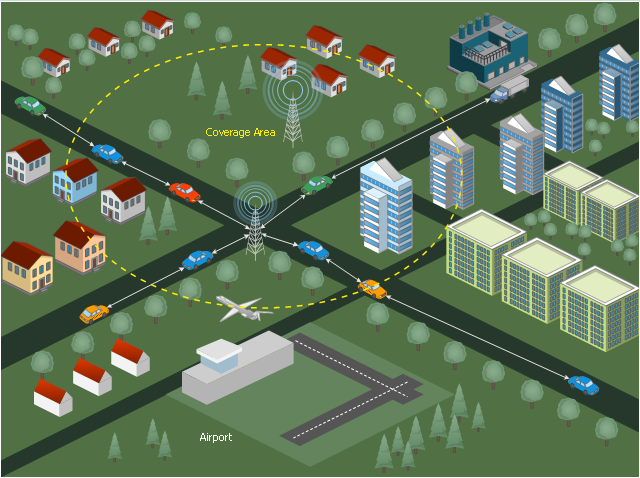
"Delay-tolerant networking (DTN) is an approach to computer network architecture that seeks to address the technical issues in heterogeneous networks that may lack continuous network connectivity. Examples of such networks are those operating in mobile or extreme terrestrial environments, or planned networks in space.
Recently, the term disruption-tolerant networking has gained currency in the United States due to support from DARPA, which has funded many DTN projects. Disruption may occur because of the limits of wireless radio range, sparsity of mobile nodes, energy resources, attack, and noise." [Delay-tolerant networking. Wikipedia]
"Routing in delay-tolerant networking concerns itself with the ability to transport, or route, data from a source to a destination, which is a fundamental ability all communication networks must have. Delay- and disruption-tolerant networks (DTNs) are characterized by their lack of connectivity, resulting in a lack of instantaneous end-to-end paths. In these challenging environments, popular ad hoc routing protocols such as AODV and DSR fail to establish routes. This is due to these protocols trying to first establish a complete route and then, after the route has been established, forward the actual data. However, when instantaneous end-to-end paths are difficult or impossible to establish, routing protocols must take to a "store and forward" approach, where data is incrementally moved and stored throughout the network in hopes that it will eventually reach its destination. A common technique used to maximize the probability of a message being successfully transferred is to replicate many copies of the message in hopes that one will succeed in reaching its destination." [Routing in delay-tolerant networking. Wikipedia]
The example "Cooperative vehicular delay-tolerant network diagram" was created using the ConceptDraw PRO diagramming and vector drawing software extended with the Vehicular Networking solution from the Computer and Networks area of ConceptDraw Solution Park.
Vehicular network diagram
 Project Management Area
Project Management area provides Toolbox solutions to support solving issues related to planning, tracking, milestones, events, resource usage, and other typical project management functions.
- Probability Quality Control Tools | How to Create a Venn Diagram in ...
- Accident analytic tree - FTA diagram | FTA diagram - Hazard ...
- Probability Tree Generator
- Probability Quality Control Tools | Check sheet for motor assembly ...
- Fault Tree Analysis Software | Design elements - Fault tree analysis ...
- Probability Quality Control Tools | How to Create a Venn Diagram in ...
- Fault Tree Analysis Diagrams | Fault Tree Analysis Software ...
- Fault Tree Analysis Diagrams | Process Flowchart | Fishbone ...
- Fault Tree Analysis Software | How to Create a Fault Tree Analysis ...
- Fault Tree Analysis Diagrams | Fault Tree Analysis Software | Fault ...
- Fault Tree Analysis Diagrams | Root cause analysis tree diagram ...
- FTA diagram - Hazard analysis | Design elements - Fault tree ...
- Fault Tree Analysis Software
- Fishbone Diagram | Fault Tree Analysis Diagrams | Structured ...
- Fault Tree Analysis Example
- Fault Tree Analysis Template
- Design elements - Fault tree analysis diagrams | FTA diagram ...
- Fault Tree Analysis Software | Accident analytic tree - FTA diagram ...
- Electrical Drawing Software | Engineering | How to Create a Fault ...
- Fault Tree Analysis Diagrams