How To Make Histogram in ConceptDraw DIAGRAM ?

Flowchart Marketing Process. Flowchart Examples

Risk Diagram (Process Decision Program Chart)
 *")
Business Structure

Preventive Action


Pyramid Diagram

 Healthcare Management Workflow Diagrams
Healthcare Management Workflow Diagrams solution contains large set of colorful samples and libraries with predesigned vector pictograms and symbols of health, healthcare equipment, medical instruments, pharmaceutical tools, transport, medication, departments of healthcare organizations, the medical icons of people and human anatomy, flowchart objects, connectors, and arrows, which make it the best for designing clear and comprehensive Medical Workflow Diagrams and Block Diagrams, Healthcare Management Flowcharts and Infographics, Healthcare Workflow Diagram, for depicting the healthcare workflow and clinical workflows in healthcare, for making the workflow analysis healthcare and healthcare workflow management.
Histogram

Influence Diagram Software

Venn Diagram Template for Word

Organization Structure

PDPC

Decision Tree Analysis

The ConceptDraw DIAGRAM diagramming and drawing software is the one that can help with creating the needed drawing, including a decision tree. Making decision tree analysis, it is always easy to make the needed matrix as there are plenty of pre-made templates to be used.
Workflow Process Example

Functional Flow Block Diagram

Venn Diagram Examples for Problem Solving


SSADM Diagram

The vector stencils library "HR department" contains 50 workflow symbols.
Use this department icon set to draw your HR process flowcharts, workflow diagrams and infographics with the ConceptDraw PRO diagramming and vector drawing software.
The HR pictograms library "HR department" is included in the HR Flowcharts solution from the Management area of ConceptDraw Solution Park.
Accounting

Accounts payable

Accounts receivable

Audit

Bank

Board of directors

Career center

Copy center

Customer service operator

Customer service technician

Data center

Delivery

Design

Devices management

Distribution

Distribution 2

Employee

Engineering

Facilities

Finance

Human resource

Information services

Information systems

International division

International marketing

International sales

Inventory

Legal department

Mail room

Mail service

Management

Manufacturing

Marketing

Motorpool

Online service

Packaging

Payroll

Publications

Purchasing

Quality assurance

Receiving

Reception

Research and development

Scales

Sales growth

Security

Shipping

Suppliers

Telecommunication

Warehouse

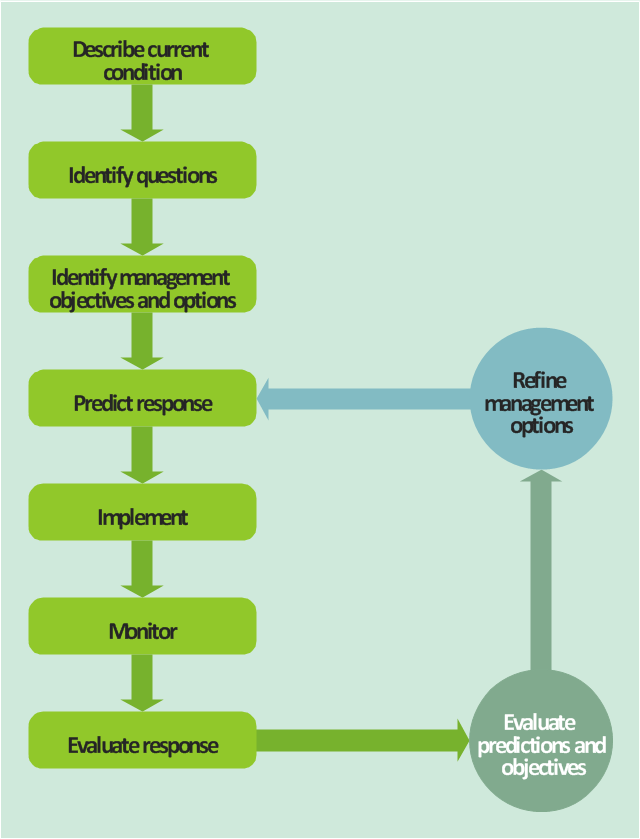
This TQM diagram sample was redesigned from the illustration of "Inland acid sulfate soil and water quality fact sheet" from website of the Department of the Environment of the Australian Government.
[environment.gov.au/ resource/ inland-acid-sulfate-soil-and-water-quality-fact-sheet]
"Adaptive management (AM), also known as adaptive resource management (ARM), is a structured, iterative process of robust decision making in the face of uncertainty, with an aim to reducing uncertainty over time via system monitoring. In this way, decision making simultaneously meets one or more resource management objectives and, either passively or actively, accrues information needed to improve future management. Adaptive management is a tool which should be used not only to change a system, but also to learn about the system (Holling 1978). Because adaptive management is based on a learning process, it improves long-run management outcomes. The challenge in using the adaptive management approach lies in finding the correct balance between gaining knowledge to improve management in the future and achieving the best short-term outcome based on current knowledge (Allan & Stankey 2009)." [Adaptive management. Wikipedia]
The TQM flowchart example "Acid sulfate soil adaptive management framework" was created using the ConceptDraw PRO diagramming and vector drawing software extended with the Total Quality Management (TQM) Diagrams solution from the Quality area of ConceptDraw Solution Park.
TQM diagram
- Probability Quality Control Tools | Process Flowchart | TQM Diagram ...
- Probability Quality Control Tools | Basic Flowchart Symbols and ...
- Probability Quality Control Tools | Process Flowchart
- Total Quality Management Value | Process Flowchart | Probability ...
- Probability Quality Control Tools | Quality Control Chart Software ...
- Process Flowchart | TQM Diagram Tool | Probability Quality Control ...
- Probability Quality Control Tools | Process Flowchart | Types of ...
- Definition TQM Diagram | Probability Quality Control Tools | Create ...
- Process Flowchart | Probability Quality Control Tools