PROBLEM ANALYSIS. Prioritization Matrix


SWOT Matrix Template

HelpDesk
How To Create a Prioritization Matrix

PROBLEM ANALYSIS. Identify and Structure Factors

The Action Plan

Corrective Action Planning

CORRECTIVE ACTIONS PLANNING. Risk Diagram (PDPC)

"A prioritization matrix is a simple tool that provides a way to sort a diverse set of items into an order of importance. It also identifies their relative importance by deriving a numerical value for the priority of each item.
The matrix provides a means for ranking projects (or project requests) based on criteria that are determined to be important. This enables a department to see clearly which projects are the most important to focus on first, and which,
if any, could be put on hold or discontinued." [oqi.wisc.edu/ resourcelibrary/ uploads/ resources/ Project_ Prioritization_ Guide_ v_ 1.pdf]
The sales activity prioritization matrix example was created using the ConceptDraw PRO diagramming and vector drawing software extended with the solution "Seven Management and Planning Tools" from the Management area of ConceptDraw Solution Park.
Prioritization matrix
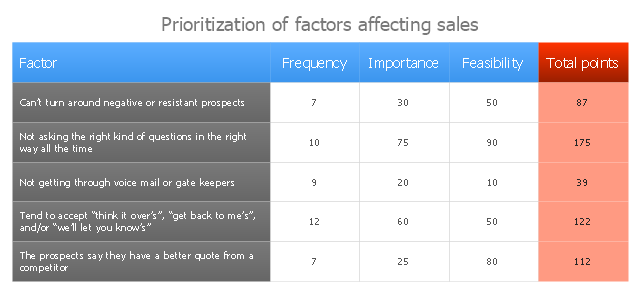
The prioritization matrix ranks factors. The process allows one to identify the factors that are the first priority. These factors can then be analyzed for possible corrective actions. The prioritization matrix allows for the weighting of each identified criterion.
"Prioritization Matrix.
This tool is used to prioritize items and describe them in terms of weighted criteria. It uses a combination of tree and matrix diagramming techniques to do a pair-wise evaluation of items and to narrow down options to the most desired or most effective. Popular applications for the Prioritization Matrix include Return-on-Investment (ROI) or Cost-Benefit analysis (Investment vs. Return), Time management Matrix (Urgency vs. Importance), etc." [Seven Management and Planning Tools. Wikipedia]
The prioritization matrix is one of the Seven Management and Planning Tools (7 MP tools, Seven New Quality Tools).
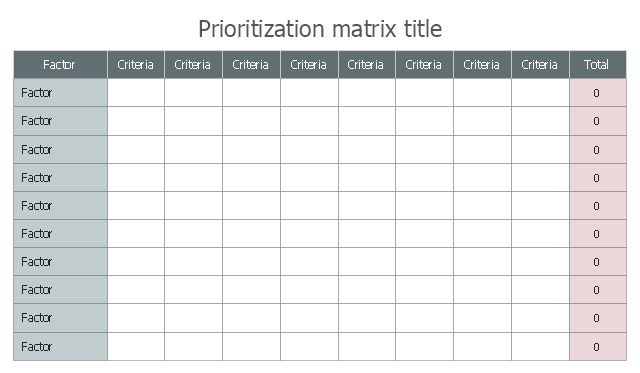
The prioritization matrix template for the ConceptDraw PRO diagramming and vector drawing software is included in the solution "Seven Management and Planning Tools" from the Management area of ConceptDraw Solution Park.
"Prioritization Matrix.
This tool is used to prioritize items and describe them in terms of weighted criteria. It uses a combination of tree and matrix diagramming techniques to do a pair-wise evaluation of items and to narrow down options to the most desired or most effective. Popular applications for the Prioritization Matrix include Return-on-Investment (ROI) or Cost-Benefit analysis (Investment vs. Return), Time management Matrix (Urgency vs. Importance), etc." [Seven Management and Planning Tools. Wikipedia]
The prioritization matrix is one of the Seven Management and Planning Tools (7 MP tools, Seven New Quality Tools).
The prioritization matrix template for the ConceptDraw PRO diagramming and vector drawing software is included in the solution "Seven Management and Planning Tools" from the Management area of ConceptDraw Solution Park.
Prioritization matrix template
HelpDesk
How to Manage Problem Solving Using Seven Management and Planning Tools

Organizational Charts with ConceptDraw DIAGRAM

Pyramid Diagram

 Pyramid Diagrams
Pyramid Diagrams solution extends ConceptDraw DIAGRAM software with templates, samples and library of vector stencils for drawing the marketing pyramid diagrams.
Pyramid Charts

- Business Productivity Area | Pyramid Chart Examples | Sales ...
- How To Create a Prioritization Matrix | Prioritization matrix ...
- PROBLEM ANALYSIS . Prioritization Matrix
- Authority Matrix Diagram Software | SWOT and TOWS Matrix ...
- PROBLEM ANALYSIS . Prioritization Matrix | How To Create a ...
- SWOT Matrix Template | SWOT Analysis Solution - Strategy Tools ...
- PROBLEM ANALYSIS . Prioritization Matrix | Authority Matrix ...
- PROBLEM ANALYSIS . Prioritization Matrix | Sales activity ...
- PROBLEM ANALYSIS . Prioritization Matrix | SWOT Matrix Template ...
- Pyramid Diagram | Priority pyramid diagram | PROBLEM ANALYSIS ...
- PROBLEM ANALYSIS . Prioritization Matrix | Sales steps - Vector ...
- PROBLEM ANALYSIS . Prioritization Matrix | PROBLEM ANALYSIS ...
- SWOT Matrix Template | How To Create an Involvement Matrix ...
- PROBLEM ANALYSIS . Root Cause Analysis Tree Diagram ...
- Cause and Effect Analysis (Fishbone Diagrams) | PROBLEM ...
- Prioritization Matrix | Design elements - Prioritization matrix | House ...
- How To Create a Prioritization Matrix | Prioritization Matrix | Design ...
- Decision Making | PROBLEM ANALYSIS . Prioritization Matrix ...
- Authority Matrix Diagram Software | PROBLEM ANALYSIS . Root ...
- PROBLEM ANALYSIS . Prioritization Matrix | Root Cause Analysis ...