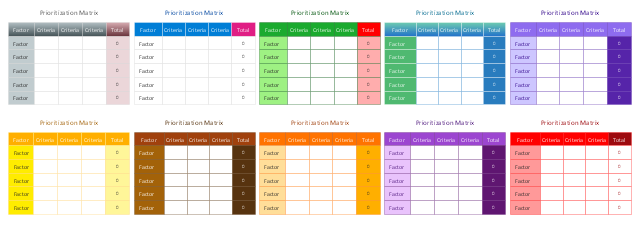
Prioritization Matrix

This vector stencils library contains 10 templates for drawing the prioritization matrices using the ConceptDraw PRO diagramming and vector drawing software.
The prioritization matrix is one of the Seven Management and Planning Tools (7 MP tools, Seven New Quality Tools).
"Prioritization Matrix ... is used to prioritize items and describe them in terms of weighted criteria. It uses a combination of tree and matrix diagramming techniques to do a pair-wise evaluation of items and to narrow down options to the most desired or most effective. Popular applications for the Prioritization Matrix include Return-on-Investment (ROI) or Cost-Benefit analysis (Investment vs. Return), Time management Matrix (Urgency vs. Importance), etc." [Seven Management and Planning Tools. Wikipedia]
Use prioritization matrix to rank items based on a set of criteria.
The example "Design elements - Prioritization matrix" is included in the solution "Seven Management and Planning Tools" from the Management area of ConceptDraw Solution Park.
Prioritization matrices
This interactive voice response (IVR) flowchart sample shows the store reporting process flow.
"Call centers use IVR systems to identify and segment callers. The ability to identify customers allows services to be tailored according to the customer profile. The caller can be given the option to wait in the queue, choose an automated service, or request a callback. The system may obtain caller line identification (CLI) data from the network to help identify or authenticate the caller. Additional caller authentication data could include account number, personal information, password and biometrics (such as voice print).
When an IVR system answers multiple phone numbers the use of DNIS ensures that the correct application and language is executed. A single large IVR system can handle calls for thousands of applications, each with its own phone numbers and script.
IVR also enables customer prioritization. In a system wherein individual customers may have a different status the service will automatically prioritize the individual's call and move customers to the front of a specific queue. Prioritization could also be based on the DNIS and call reason." [Interactive voice response. Wikipedia]
The IVR diagram example "Store reporting flowchart" was created using the ConceptDraw PRO diagramming and vector drawing software extended with the Interactive Voice Response Diagrams solution from the Computer and Networks area of ConceptDraw Solution Park.
IVR diagram

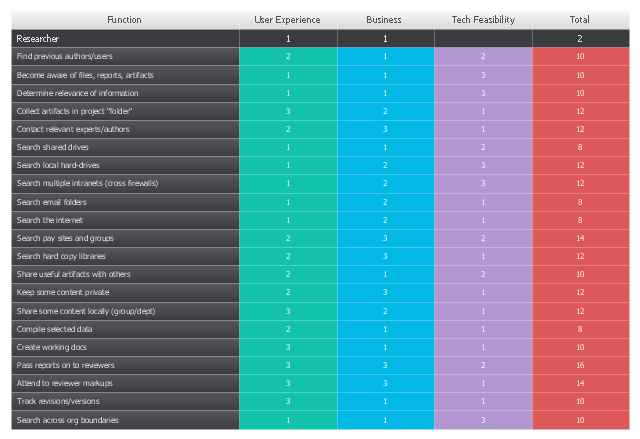
"Prioritization Matrix ... tool is used to prioritize items and describe them in terms of weighted criteria. It uses a combination of tree and matrix diagramming techniques to do a pair-wise evaluation of items and to narrow down options to the most desired or most effective. Popular applications for the Prioritization Matrix include Return-on-Investment (ROI) or Cost-Benefit analysis (Investment vs. Return), Time management Matrix (Urgency vs. Importance), etc." [Seven Management and Planning Tools. Wikipedia]
The opportunity prioritization matrix example was created using the ConceptDraw PRO diagramming and vector drawing software extended with the solution "Seven Management and Planning Tools" from the Management area of ConceptDraw Solution Park.
The opportunity prioritization matrix example was created using the ConceptDraw PRO diagramming and vector drawing software extended with the solution "Seven Management and Planning Tools" from the Management area of ConceptDraw Solution Park.
Prioritization matrix
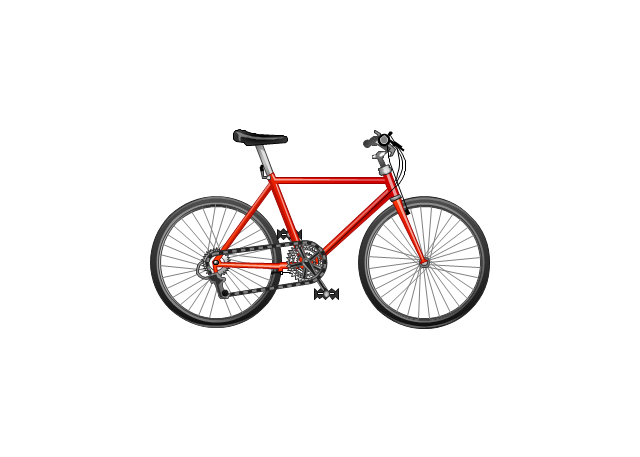
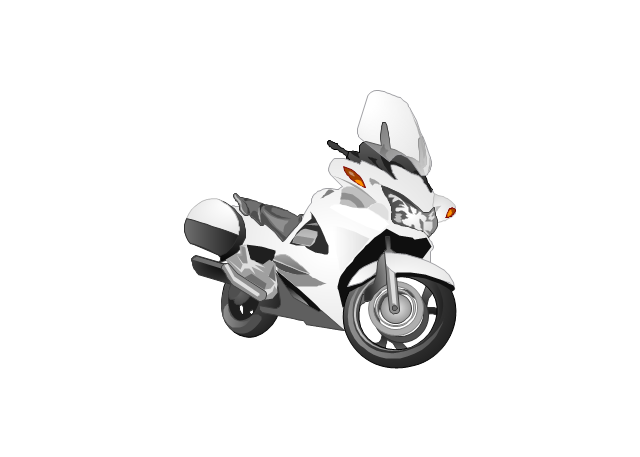
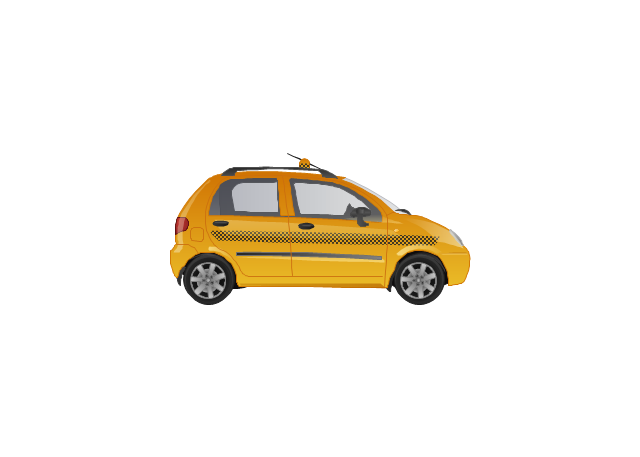
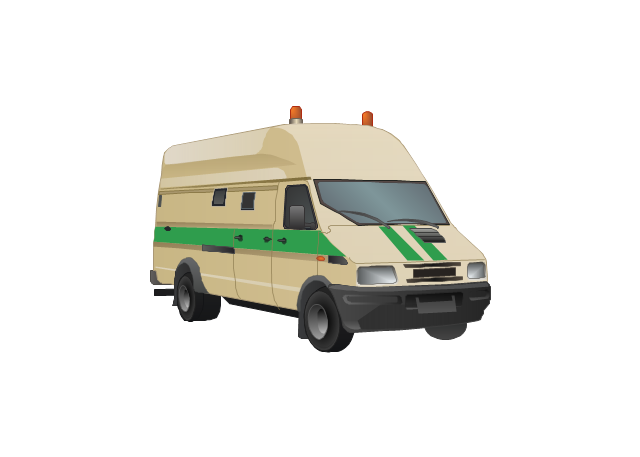
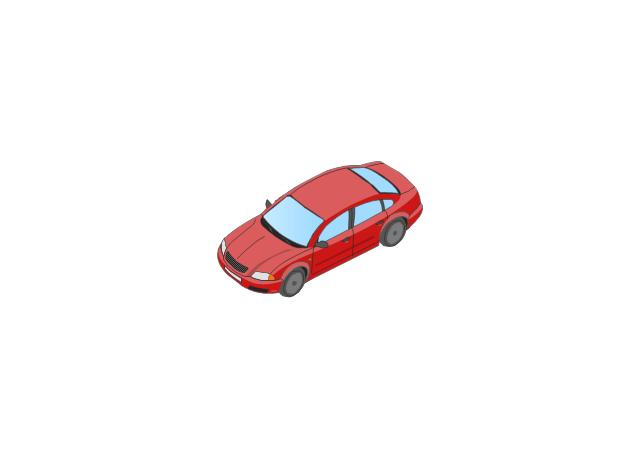
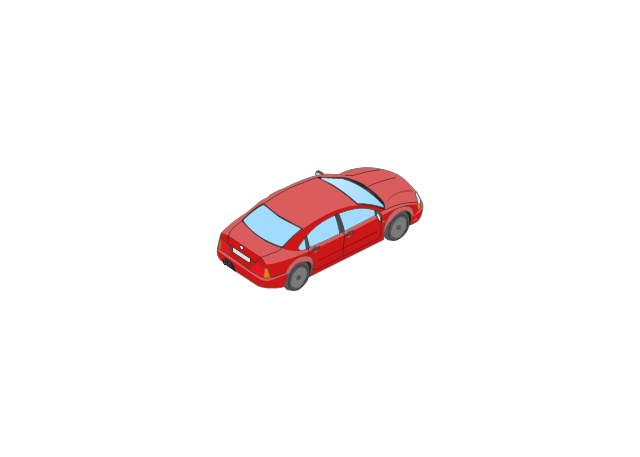
The vector stencils library "Road transport" contains 43 clip art images for creating vehicles and transportation illustrations, presentation slides, infographics and webpages using the ConceptDraw PRO diagramming and vector drawing software.
"Road transport (British English) or road transportation (American English) is the transport of passengers or goods on roads. ...
Transportation.
Transport on roads can be roughly grouped into the transportation of goods and transportation of people. In many countries licencing requirements and safety regulations ensure a separation of the two industries.
The nature of road transportation of goods depends, apart from the degree of development of the local infrastructure, on the distance the goods are transported by road, the weight and volume of the individual shipment, and the type of goods transported. For short distances and light, small shipments a van or pickup truck may be used. For large shipments even if less than a full truckload a truck is more appropriate. In some countries cargo is transported by road in horse-drawn carriages, donkey carts or other non-motorized mode. Delivery services are sometimes considered a separate category from cargo transport. In many places fast food is transported on roads by various types of vehicles. For inner city delivery of small packages and documents bike couriers are quite common.
People are transported on roads either in individual cars or automobiles, or in mass transit by bus or coach. Special modes of individual transport by road like rickshaws or velotaxis may also be locally available." [Road transport. Wikipedia]
The vector stencils library "Road transport" is included in the Aerospace and Transport solution from the Illustrations area of ConceptDraw Solution Park.
www.conceptdraw.com/ solution-park/ illustrations-aerospace-transport
Bicycle
Motorcycle
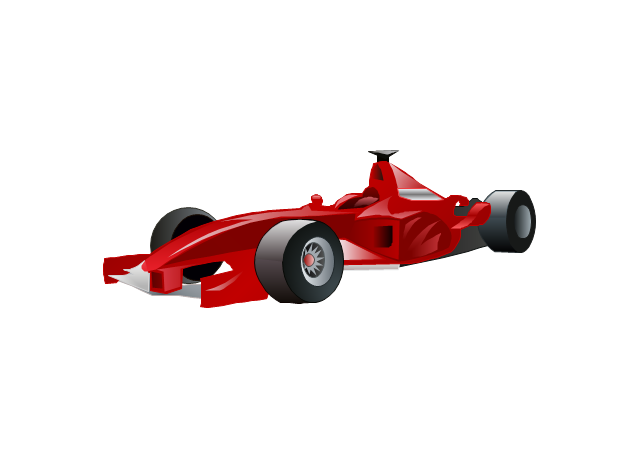
Race car
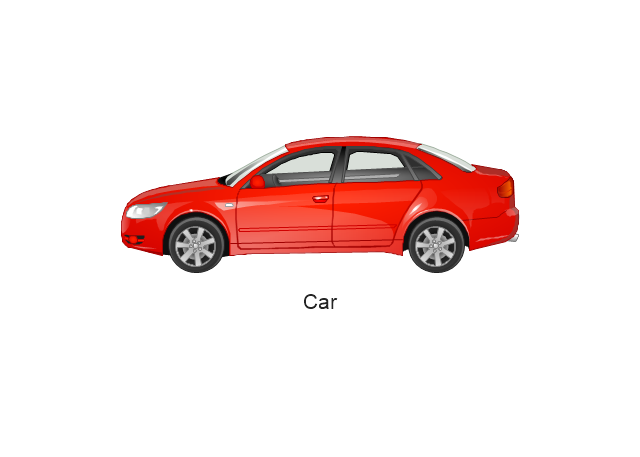
Car
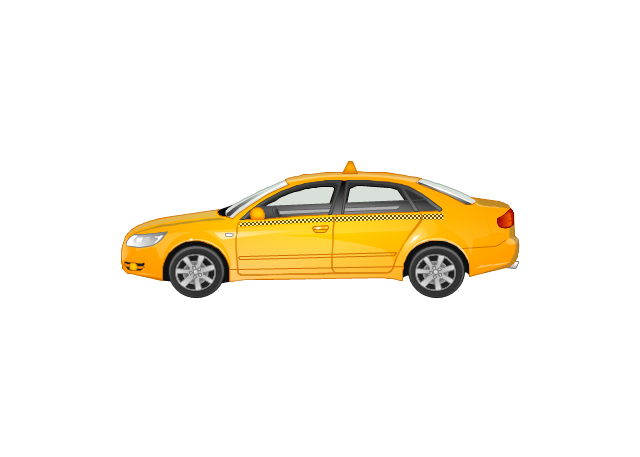
Taxi
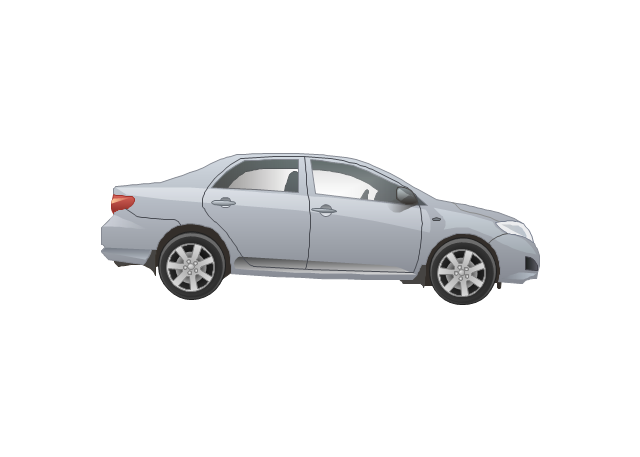
Sedan
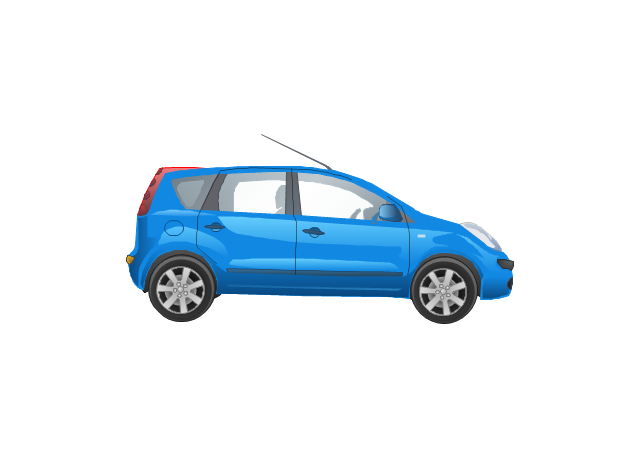
Hatchback
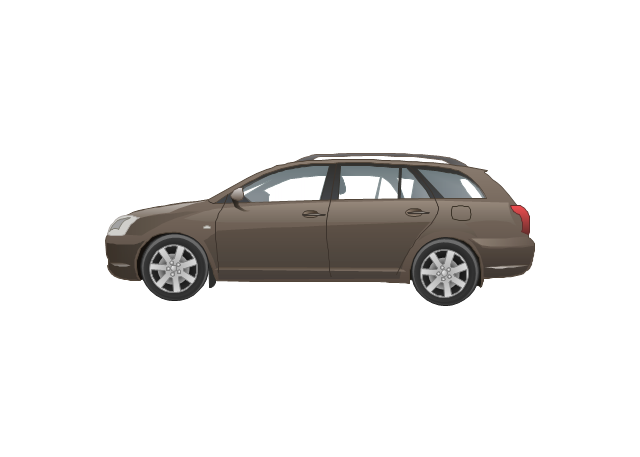
Estate car
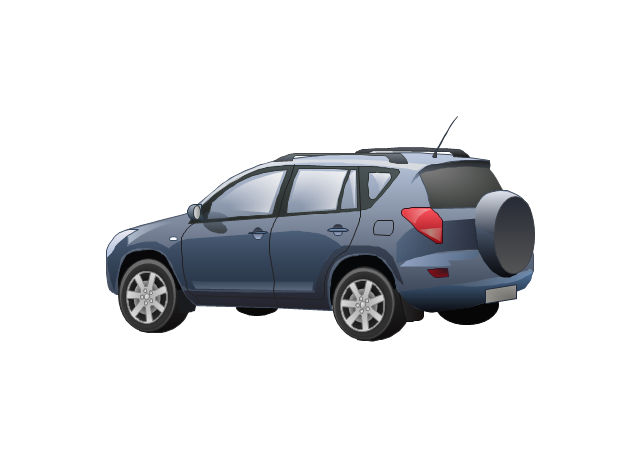
4x4
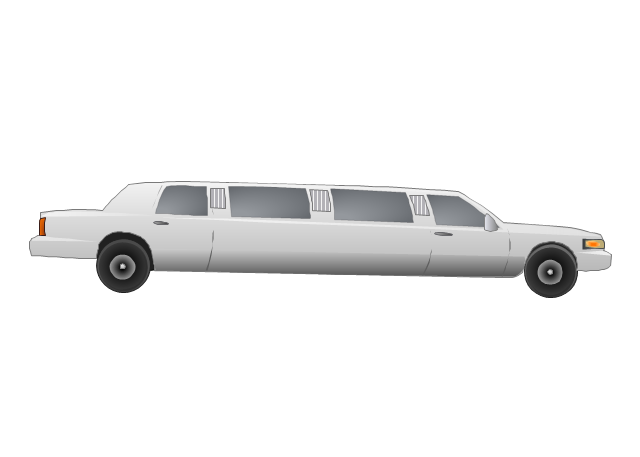
Limousine
Police car

Ambulance

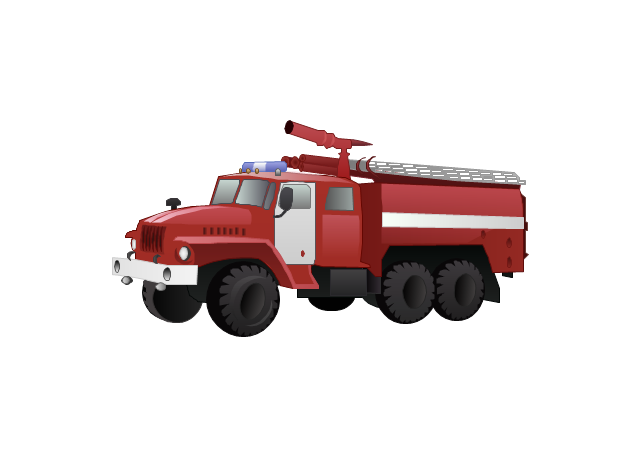
Fire apparatus
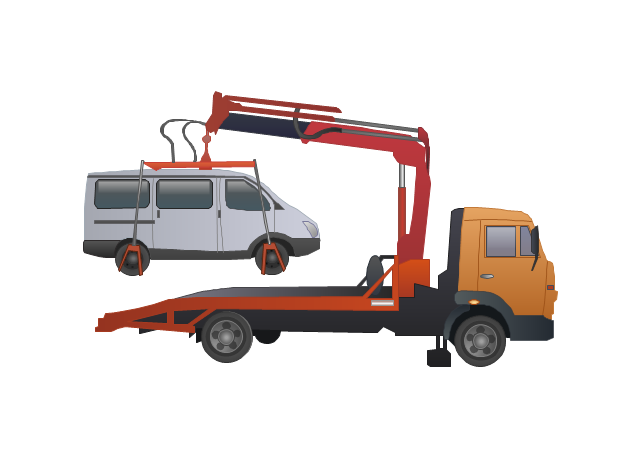
Wrecker
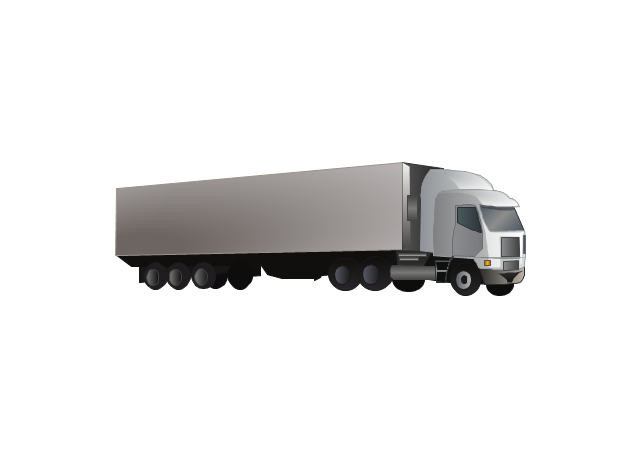
Semi truck

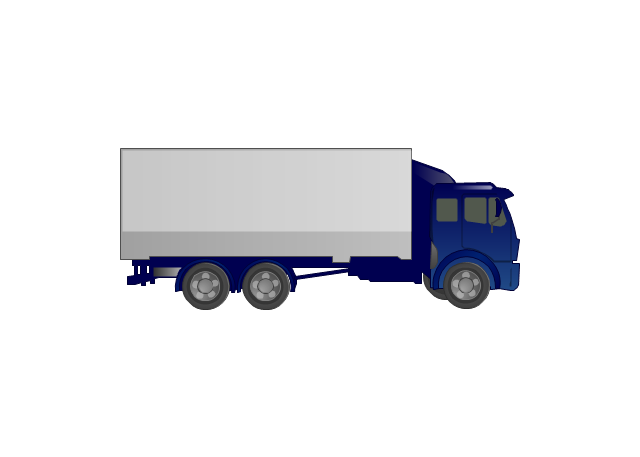
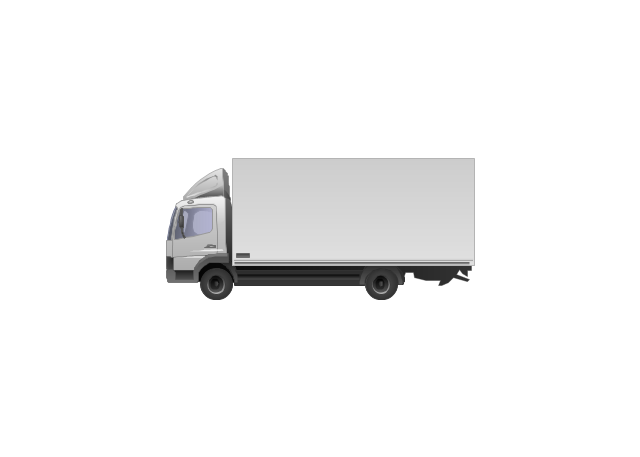
Truck
Trailer
Refrigeration Truck
Petrol Tanker
Truck
Minibus
City Bus
Bus
Sightseeing Bus
Double-decker Bus
Trolleybus
Military Ambulance
Armored police vehicle
First Aid Tent
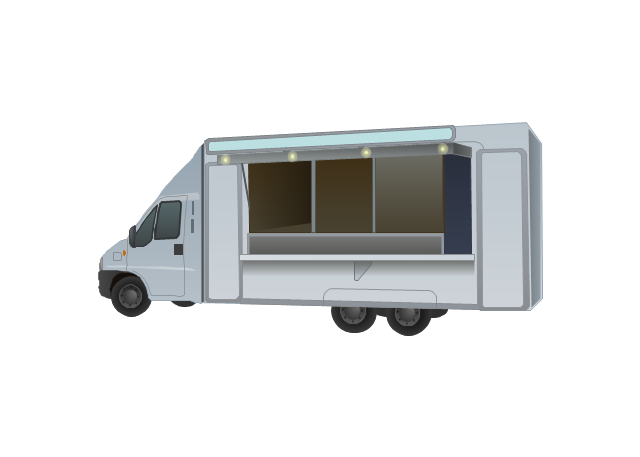
Catering Vehicle
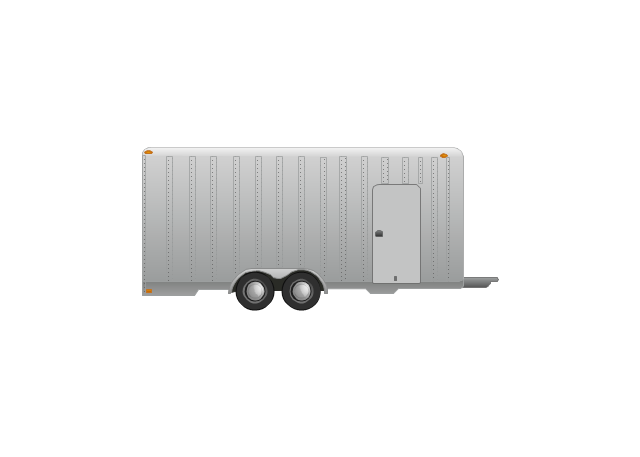
Semi-trailer
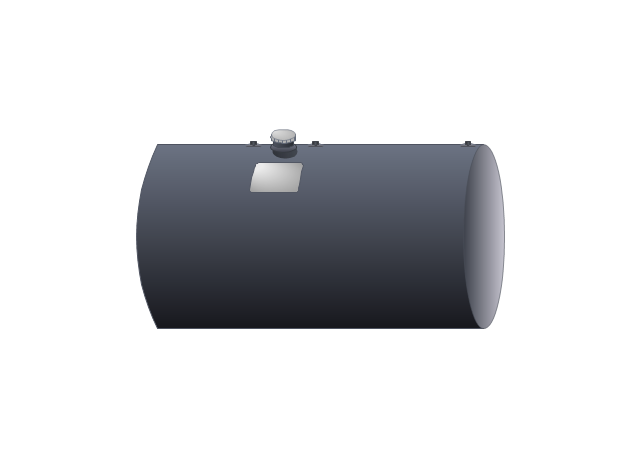
Fuel Tank
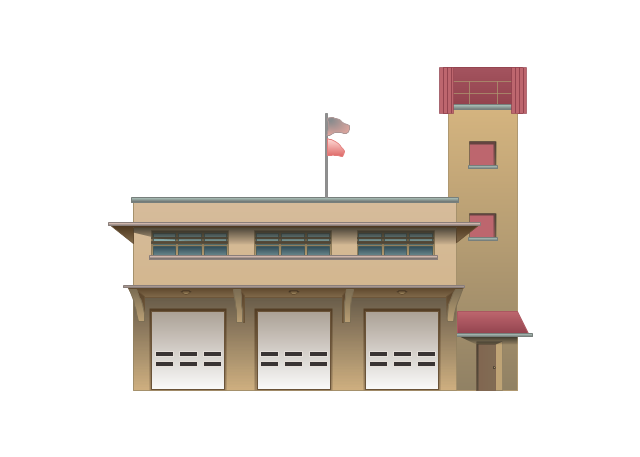
Fire Station
Signal Light
Walkie-Talkie
Lorry
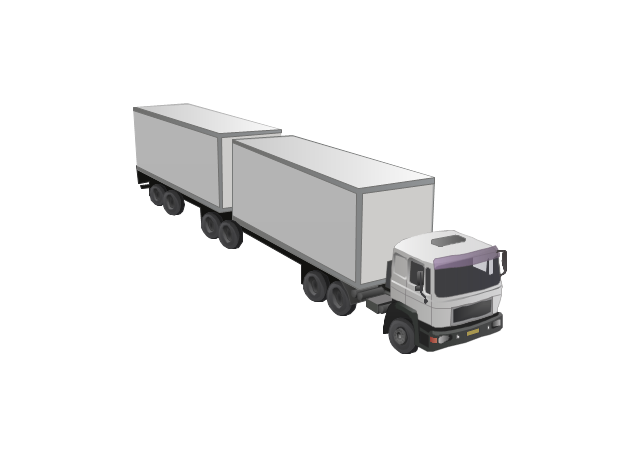
B-Train
Taxi
Armored cash transport car
Car isometric
Car isometric
Box truck isometric
Bus isometric
 Seven Management and Planning Tools
Seven Management and Planning Tools solution extends ConceptDraw PRO and ConceptDraw MINDMAP with features, templates, samples and libraries of vector stencils for drawing management mind maps and diagrams.
Activity on Node Network Diagramming Tool

7 Management & Planning Tools

 Seven Management and Planning Tools
Seven Management and Planning Tools solution extends ConceptDraw PRO and ConceptDraw MINDMAP with features, templates, samples and libraries of vector stencils for drawing management mind maps and diagrams.
This arrow loop diagram sample was created on the base of the figure illustrating the webpage "Safe Roads for a Safer Future A Joint Safety Strategic Plan" from the website of US Department of Transportation - Federal Highway Administration (FHWA) Office of Safety.
"STRATEGIC PLANNING CYCLE.
After the safety units issue the SSP, they will identify and prioritize strategies to support the established goals. Many strategies will originate in existing roadmaps or in other program planning activities. The safety units will also use this information when developing their Unit Performance Plans and individual performance plans. Teams within each safety unit will carry out projects and activities to support identified strategies and achieve the SSP goals.
The SSP process also includes continuous performance monitoring and evaluation through which the safety units will review past accomplishments against the established goals, consider how well strategies are implemented, assess progress toward goals, identify risks, consider changes in the environment, and discuss future strategic direction. As a part of the evaluation process, the three safety units will recognize achievements and discuss the need for adjustments. Figure ... shows the strategic planning cycle.
The safety units will update the SSP every 3 to 5 years using input from a variety of sources, including evaluations, safety trends, and legislative changes." [safety.fhwa.dot.gov/ ssp/ ]
The arrow loop diagram example "Strategic planning cycle" was created using the ConceptDraw PRO diagramming and vector drawing software extended with the Target and Circular Diagrams solution from the Marketing area of ConceptDraw Solution Park.
www.conceptdraw.com/ solution-park/ marketing-target-and-circular-diagrams
Arrow loop diagram
"Business process improvement (BPI) is a systematic approach to help an organization optimize its underlying processes to achieve more efficient results. ...
An organization is only as good as its processes. To be able to make the necessary changes in an organization, one needs to understand the key processes of the company. Rummler and Brache suggested a model for running a Process Improvement and Management project (PI&M), containing the following steps:
1. Identify the process to be improved (based on a critical business issue): The identification of key processes can be a formal or informal exercise. The management team might select processes by applying a set of criteria derived from strategic and tactical priorities, or process selection is based on obvious performance gaps. It is important is to select the process(es) which have the greatest impact on a competitive advantage or customer requirement.
2. Develop the objective(s) for the project based on the requirements of the process: The focus might be on quality improvement, productivity, cost, customer service or cycle time. The goal is however always the same; to get the key process under control.
3. Select the members of the cross-functional team: A horizontal (cross-functional) analysis is carried out by a team composed of representatives of all functions involved in the process. While a consultant or in-house staff person can do the job, the quality of the analysis and the commitment to change is far greater with a cross-functional team.
4. Document the current process by creating a flowchart or "organization map": Describe the process regarding the Organizational level, the Process level and the Job/ Performer level according to Rummler. Develop a cross-functional process map for the process.
5. Identify "disconnects" in the process: “Disconnections” are everything that inhibit the efficiency and effectiveness of the process. The identification should be categorized into the three levels: The Organizational level, the Process level and the Job/ Performer level.
6. Recommend changes (organizational, in the process or in its execution): Categorize and prioritize the main problems and possibilities, evaluate alternative solutions. Develop a cross-functional process map for the recommended process.
7. Establish process and sub-process measures: The process measures should reflect the objectives of the project.
8. Implement the improvements." [Business process improvement. Wikipedia]
The opportunity flow chart example "Replacing engine oil" was created using the ConceptDraw PRO diagramming and vector drawing software extended with the Cross-Functional Flowcharts solution from the Business Processes area of ConceptDraw Solution Park.
Opportunity flowchart

Scrum workflow

Scrum process work items and workflow

 Target and Circular Diagrams
This solution extends ConceptDraw PRO software with samples, templates and library of design elements for drawing the Target and Circular Diagrams.
 Scrum Workflow
The Scrum Workflow Solution extends the capabilities of ConceptDraw PRO 10 with a large collection of professionally-designed samples and a selection of ready-to-use scrum design elements: scrum diagrams and arrows, scrum icons of people, artifacts, workflow, workspace and other colorful scrum clipart, and also scrum charts.
- PROBLEM ANALYSIS. Prioritization Matrix | How To Create a ...
- Prioritization matrix - Template | Prioritization Matrix | Opportunity ...
- How To Create a Prioritization Matrix | Prioritization matrix ...
- Prioritization Matrix | Prioritization matrix - Template | Opportunity ...
- PROBLEM ANALYSIS. Prioritization Matrix | Matrix Organization ...
- How To Create a Prioritization Matrix | Prioritization Matrix ...
- Prioritization Matrix | Design elements - Prioritization matrix ...
- Prioritization Matrix | Opportunity prioritization matrix | Sales activity ...
- Prioritization Matrix | How To Create a Prioritization Matrix ...
- PROBLEM ANALYSIS. Prioritization Matrix | Prioritization Matrix ...
- PROBLEM ANALYSIS. Prioritization Matrix | How To Create a ...
- How To Create a Prioritization Matrix | PROBLEM ANALYSIS ...
- PROBLEM ANALYSIS. Prioritization Matrix | PROBLEM ANALYSIS ...
- PERT Chart Software | Prioritization Matrix | Corrective Action ...
- Draw A Flowchart To Show How To Prioritize Maintenance Request
- How To Create a Prioritization Matrix | Prioritization Matrix | Seven ...
- Prioritization matrix - Template | Prioritization Matrix | HR ...
- Matrix Organization Structure | How To Create a Prioritization Matrix ...
- Prioritization Matrix | Design elements - Prioritization matrix | Urgent ...
- Authority Matrix Diagram Software | PROBLEM ANALYSIS ...