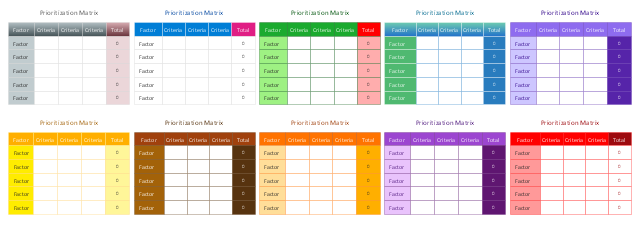
Prioritization Matrix

This vector stencils library contains 10 templates for drawing the prioritization matrices using the ConceptDraw PRO diagramming and vector drawing software.
The prioritization matrix is one of the Seven Management and Planning Tools (7 MP tools, Seven New Quality Tools).
"Prioritization Matrix ... is used to prioritize items and describe them in terms of weighted criteria. It uses a combination of tree and matrix diagramming techniques to do a pair-wise evaluation of items and to narrow down options to the most desired or most effective. Popular applications for the Prioritization Matrix include Return-on-Investment (ROI) or Cost-Benefit analysis (Investment vs. Return), Time management Matrix (Urgency vs. Importance), etc." [Seven Management and Planning Tools. Wikipedia]
Use prioritization matrix to rank items based on a set of criteria.
The example "Design elements - Prioritization matrix" is included in the solution "Seven Management and Planning Tools" from the Management area of ConceptDraw Solution Park.
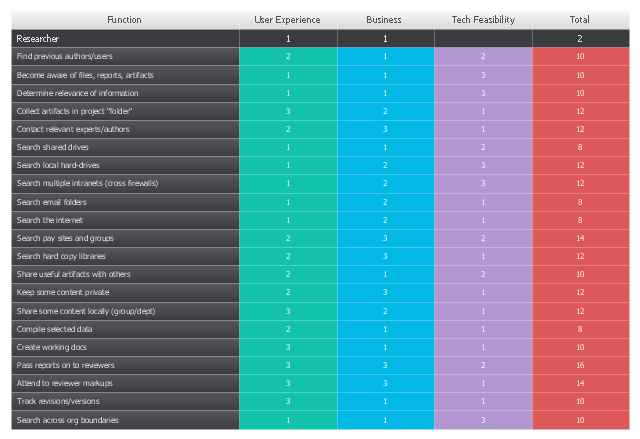
Prioritization matrices
"Prioritization Matrix ... tool is used to prioritize items and describe them in terms of weighted criteria. It uses a combination of tree and matrix diagramming techniques to do a pair-wise evaluation of items and to narrow down options to the most desired or most effective. Popular applications for the Prioritization Matrix include Return-on-Investment (ROI) or Cost-Benefit analysis (Investment vs. Return), Time management Matrix (Urgency vs. Importance), etc." [Seven Management and Planning Tools. Wikipedia]
The opportunity prioritization matrix example was created using the ConceptDraw PRO diagramming and vector drawing software extended with the solution "Seven Management and Planning Tools" from the Management area of ConceptDraw Solution Park.
The opportunity prioritization matrix example was created using the ConceptDraw PRO diagramming and vector drawing software extended with the solution "Seven Management and Planning Tools" from the Management area of ConceptDraw Solution Park.
Prioritization matrix
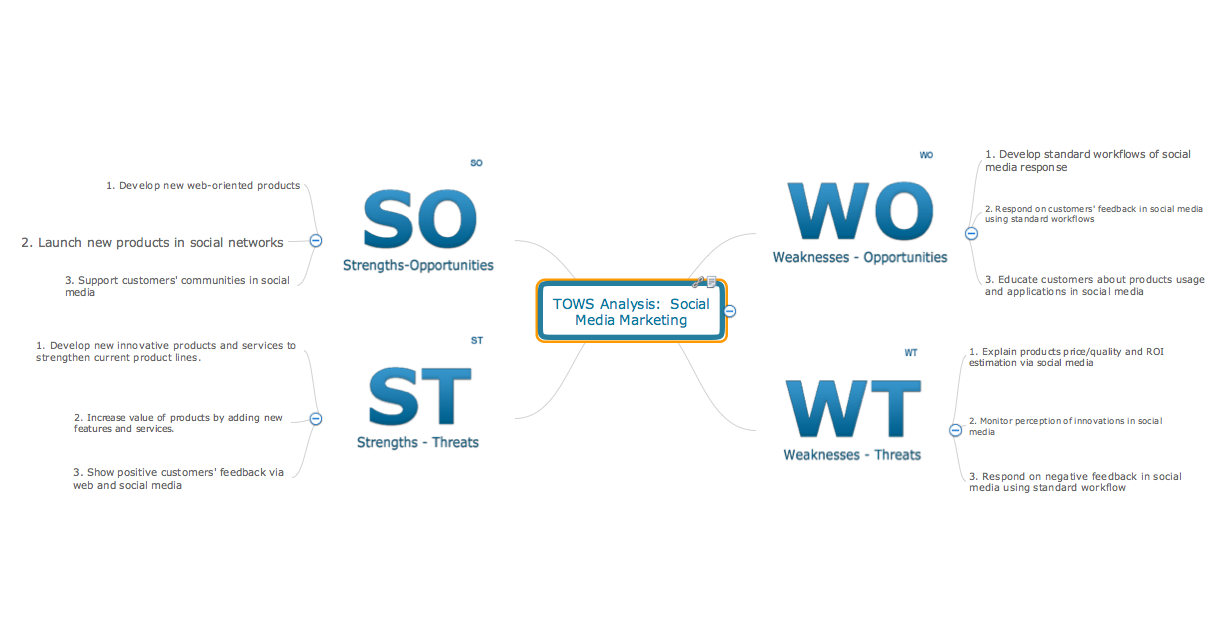
SWOT analysis matrix diagram templates

 SWOT and TOWS Matrix Diagrams
SWOT and TOWS Matrix Diagrams solution extends ConceptDraw DIAGRAM and ConceptDraw MINDMAP software with features, templates, samples and libraries of vector stencils for drawing SWOT and TOWS analysis matrices and mind maps.
SWOT Analysis
SWOT Template

 Meter Dashboard
Meter dashboard solution extends ConceptDraw DIAGRAM software with templates, samples and vector stencils library with meter indicators for drawing visual dashboards showing quantitative data.
SWOT Analysis

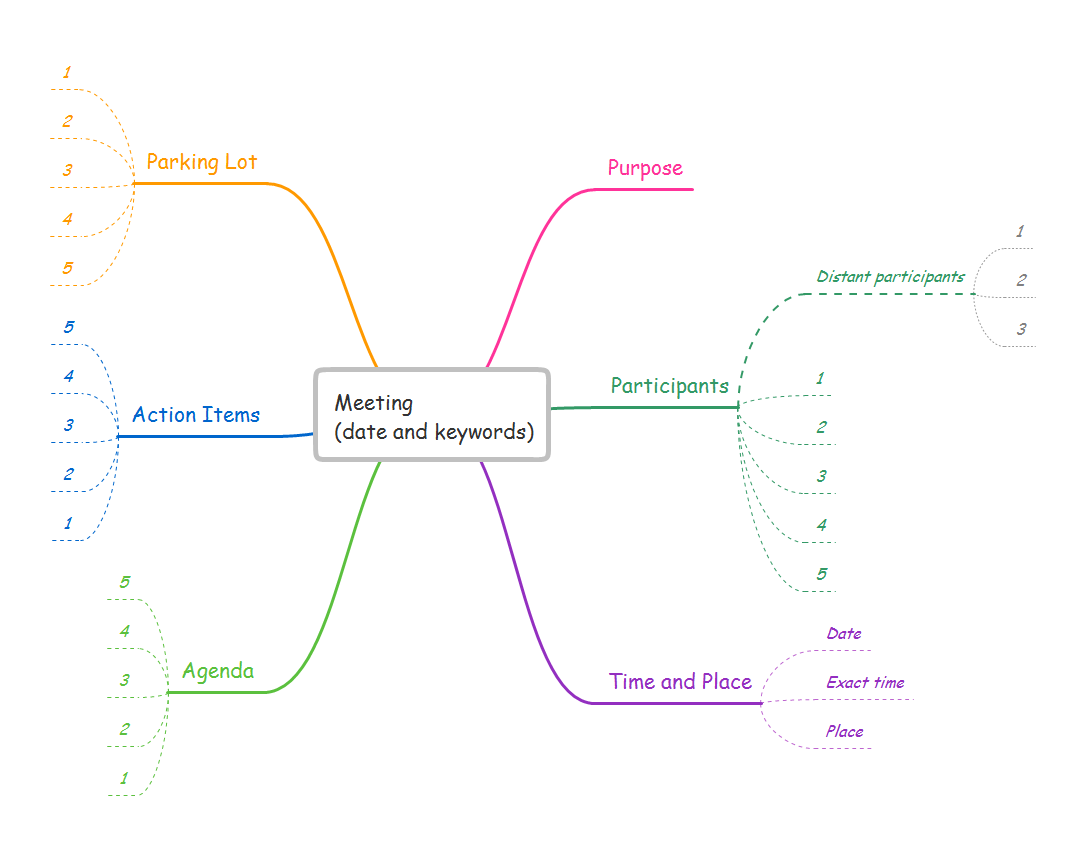
A Tool for EffectiveTeam Meetings

- Prioritization Matrix | Prioritization matrix - Template | Design ...
- Prioritization Matrix | Roi Diagram
- Prioritization Matrix | Creating An Roi Graph
- Prioritization Matrix | Calculate Roi
- Prioritization Matrix | Standard Roi Of A Project
- Pie Chart Examples and Templates | Prioritization Matrix | SWOT ...
- Prioritization Matrix | Pie Chart Examples and Templates ...
- PROBLEM ANALYSIS. Prioritization Matrix | Matrix Organization ...
- Roi Project