This site uses cookies. By continuing to browse the ConceptDraw site you are agreeing to our Use of Site Cookies.

Pie Chart Examples and Templates

A pie chart or a circle graph is a circular chart divided into sectors, illustrating numerical proportion. In a pie chart, the arc length of each sector and consequently its central angle and area, is proportional to the quantity it represents.

Pie chart examples and templates created using ConceptDraw DIAGRAM software helps you get closer with pie charts and find pie chart examples suite your needs.

Prioritization Matrix

You can design the Prioritization Matrix by hand on the paper, but we offer you the most easier way — to use the ConceptDraw DIAGRAM diagramming and vector drawing software extended with Seven Management and Planning Tools Solution from the Management Area.

meter dashboard, quantitative indicators Meter Dashboard

meter dashboard, quantitative indicators
Meter dashboard solution extends ConceptDraw DIAGRAM software with templates, samples and vector stencils library with meter indicators for drawing visual dashboards showing quantitative data.

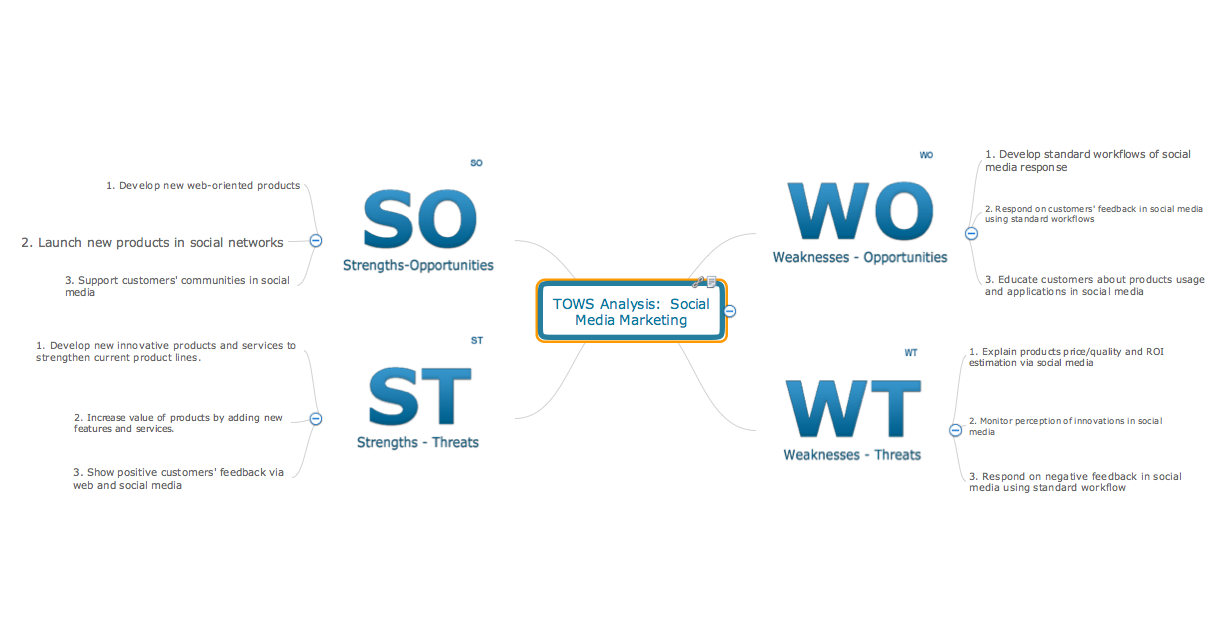
SWOT analysis matrix diagram templates

Every day each company has challenge how to win the rally with competors. How to determine a path to the successful business? The one of best methodologies is SWOT Analysis. Abbreviation SWOT definition: S = strengths, W = weaknesses, O = opportunities, T = threats. Often named SWOT Matrix was introduced first at 1960s as examining tool of internal capabilities and possibilities of big companies. The SWOT analysis aim is to find critical factors influenced to company's business goal. You can begin a strategy to distinguish better competition value and to become successful in your market. Achiving best results form SWOT analysis can be reached when several employees will be involved at the process. Management, sales and customer service can all offer reasonable comprehension competitive situation.

SWOT analysis, TOWS analysis SWOT and TOWS Matrix Diagrams

SWOT analysis, TOWS analysis
SWOT and TOWS Matrix Diagrams solution extends ConceptDraw DIAGRAM and ConceptDraw MINDMAP software with features, templates, samples and libraries of vector stencils for drawing SWOT and TOWS analysis matrices and mind maps.

Collaboration in a Project Team

Create with our data flow diagram software perfect data flow diagrams. Download data flow diagram software for FREE. Use hundreds of data flow diagram examples.

SWOT Analysis

Using mind mapping to define Strengths, Weaknesses/Limitations, Opportunities, and Threats is a natural fit. SWOT mind maps quickly capture your ideas, and allow you to add and subtract easily, ensuring you don’t overlook any important items.

How To Conduct Effective Team Briefings

A team briefing tool is an excellent way to enable communication upwards, downwards and sideways throughout an organisation.

A Tool for EffectiveTeam Meetings

Use team meetings, share ideas, brainstorm ideas, team notes with ConceptDraw solution.