Prioritization Matrix

 Seven Management and Planning Tools
Seven Management and Planning Tools solution extends ConceptDraw DIAGRAM and ConceptDraw MINDMAP with features, templates, samples and libraries of vector stencils for drawing management mind maps and diagrams.
Decision Making


Cause and Effect Analysis

Influence Diagram

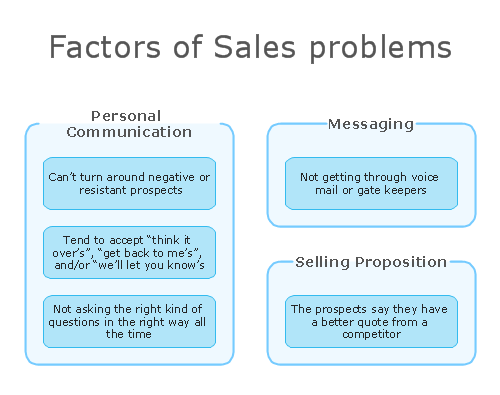
Affinity Diagram
Influence Diagram Software

PDPC

CORRECTIVE ACTIONS PLANNING. Risk Diagram (PDPC)

Pyramid Diagram and Pyramid Chart

- The Graph Which Helps To Identify And Prioritize Problems To Be
- Prioritizing Tasks Chart
- Schedule pie chart - Daily action plan | Prioritization Matrix | Pyramid ...
- Prioritization Matrix | Prioritization matrix - Template | Design ...
- Problem solving | Fishbone Diagram Problem Solving | Using ...
- Competitive feature comparison matrix chart - Digital scouting ...
- SWOT matrix template | How to Draw a Good Diagram of a Business ...
- Process Flowchart | Prioritization Matrix | MS Visio Look a Like ...
- Application Of Matix Diagram In Tqm
- How to Draw a Matrix Organizational Chart | Matrix Organization ...