Line Chart Examples

Line Graph

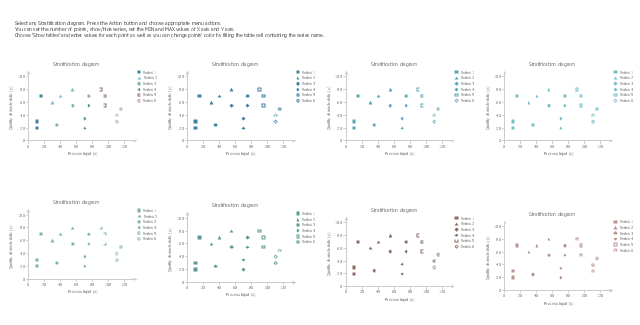
The vector stencils library "Stratification diagram" contains 8 multiseries scatterplot templates.
Use it to design your stratification diagrams with ConceptDraw PRO diagramming and vector drawing software.
"In statistics, stratified sampling is a method of sampling from a population.
In statistical surveys, when subpopulations within an overall population vary, it is advantageous to sample each subpopulation (stratum) independently. Stratification is the process of dividing members of the population into homogeneous subgroups before sampling. The strata should be mutually exclusive: every element in the population must be assigned to only one stratum. The strata should also be collectively exhaustive: no population element can be excluded. Then simple random sampling or systematic sampling is applied within each stratum. This often improves the representativeness of the sample by reducing sampling error. It can produce a weighted mean that has less variability than the arithmetic mean of a simple random sample of the population." [Stratified sampling. Wikipedia]
The stratification is one of the Seven Basic Tools of Quality. [Seven Basic Tools of Quality. Wikipedia]
The example of multiseries scatterplot templates "Design elements - Stratification diagram" is included in the Seven Basic Tools of Quality solution from the Quality area of ConceptDraw Solution Park.
Multiseries scatterplot templates
Basic Diagramming


 Circle-Spoke Diagrams
Examples of subject areas that are well suited to this approach are marketing, business, products promotion, process modeling, market, resource, time, and cost analysis. Circle-Spoke Diagrams are successfully used in presentations, conferences, management documents, magazines, reportages, reviews, reports, TV, and social media.
Pyramid Diagram

Pictures of Graphs

What Is a Line Chart

Picture Graph

Geo Map - Asia

This onion diagram sample was created on the base of the figure "Social Ecological Model (SEM)" illustrating the webpage "Cultural Competence" from the US Centers for Disease Control and Prevention (CDC) website.
"Why consider cultural competence?
It is important to communicate effectively to both the disparately affected population(s) of interest as well as other key stakeholders at the community, state, and national levels.
The diagram of the Social Ecological Model (SEM) ... depicts how health behaviors of an individual (inner oval) are influenced by the interpersonal, organizational, community, and public policy contexts and environment in which that person exists. Cultural context resides in the interpersonal band, making it a critical consideration when designing any communication plan. All obesity prevention communications should take the culture (e.g., language, thoughts, communications, actions, customs, beliefs, values, and institutions of racial, ethnic, religious, or social groups) of the target population into consideration to be effective. Interventions that successfully achieve this goal demonstrate cultural competence - behaviors, attitudes, and policies that come together in a system, agency, or among professionals to enable people to work effectively in a cross-cultural situation."
[cdc.gov/ obesity/ health_ equity/ culturalRelevance.html]
The onion diagram example "Social Ecological Model (SEM)" was created using the ConceptDraw PRO diagramming and vector drawing software extended with the Target and Circular Diagrams solution from the Marketing area of ConceptDraw Solution Park.
www.conceptdraw.com/ solution-park/ marketing-target-and-circular-diagrams
Onion diagram
---onion-diagram.png--diagram-flowchart-example.png)
 Basic Area Charts
This solution extends the capabilities of ConceptDraw PRO v10.3.0 (or later) with templates, samples and a library of vector stencils for drawing Area Charts (area graphs) that visualize changes in values by filling in the area beneath the line connecting data points.
Sample Pictorial Chart. Sample Infographics
")
Infographic Maker

- Social Population Diagram
- Line Chart Examples | Line Graph | Types of Flowchart - Overview ...
- Diagram On Population
- Diagrams Of Population Parameters
- An Easy Diagram Of Population
- Basic Diagramming | Pictures of Graphs | Picture Graph | Population ...
- Picture Graphs | Infographic Maker | Chart Templates | Population ...
- Population Chart Drawing
- Bar Graph Of Population Growth Rate
- World Population Draw Diagram
- Diagram Architecture Of Population
- Diagram On Population Data Using A Graph
- USA Maps | Basic Area Charts | Circle-Spoke Diagrams | Population ...
- Population Of Diagram
- Line Graph Of Population
- Block Diagram Of Population Growth
- Population Chart Maker
- Population Easy Diagrams
- Diagrams Of Population