"At the base of the identity of an organisational is its organizational culture. A culture is comprised of the shared values, customs, traditions, rituals, behaviours and beliefs shared by a social group (national, ethnic, organizational, etc.). Cultures also share languages, or ways of speaking. From a communication perspective, cultures are made and remade through the words we use to describe our world. Culture represents a common set of values (“shared meanings”), shared by members of a population, a organization, a project/ programme purpose unit or a profession (e.g., engineers versus scientists). Culture change with the times but the speed at which the culture of different institutions change varies widely." [Development Cooperation Handbook/ The development aid organization/ Organizational Culture. Wikibooks]
This organizational culture triangle diagram example derived from Parker and Benson's model. It's for explaination of the Regatta: Adoption Method.
The pyramid diagram example "Organizational culture" was redesigned using the ConceptDraw PRO diagramming and vector drawing software from Wikimedia Commons file Organization_ Triangle.png. [commons.wikimedia.org/ wiki/ File:Organization_ Triangle.png]
This file is licensed under the Creative Commons Attribution-Share Alike 2.5 Generic license. [creativecommons.org/ licenses/ by-sa/ 2.5/ deed.en]
The triangular chart sample "Organizational culture" is included in the Pyramid Diagrams solution from the Marketing area of ConceptDraw Solution Park.
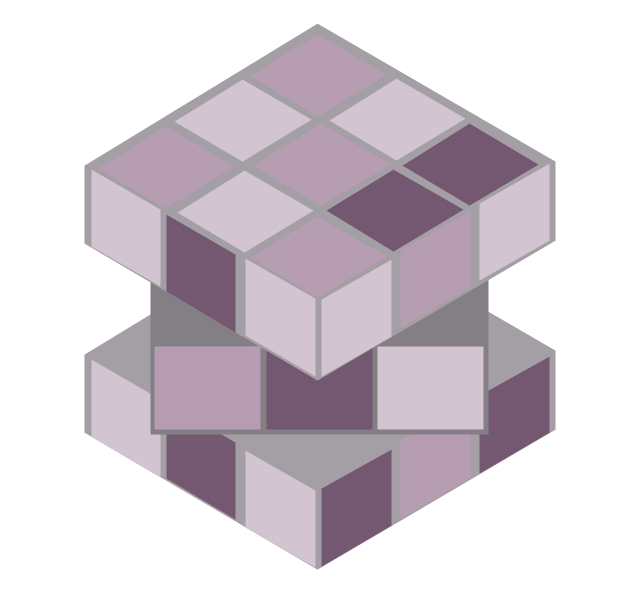
Pyramid diagram

Pyramid Diagram

Matrix Organization Structure

The vector stencils library "HR symbols" contains 45 HR pictograms.
Use this icon set with HR symbols to draw your HR flowcharts, workflow diagrams, process charts and infographics with the ConceptDraw PRO diagramming and vector drawing software.
The HR pictograms library "HR symbols" is included in the HR Flowcharts solution from the Management area of ConceptDraw Solution Park.
Absence management

Absenteeism

Achievement

Attract

Authority and accountability
Business goals

Business success

Capital formation

Career

Career ladder

Communication

Compensation management

Conflict management

Conformance

Dress code

Education

Global HR

Headhunting

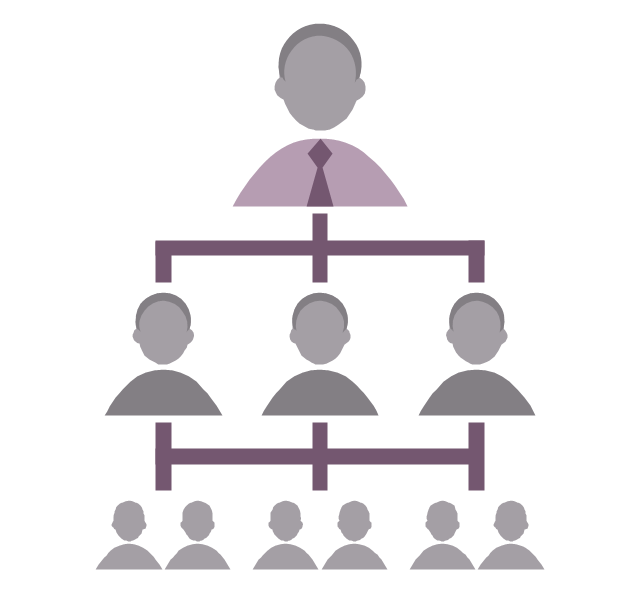
Hierarchical organization
Human capital

Human resource management

Incentive compensation management

Increase productivity

Job performance

Job satisfaction

Labor Unions
Leadership

Motivation and incentives

Organizational culture

Partnership

Performance management
Problem solving
Retention

Skill

Smart ideas

Staff turnover

Succession management

Talent acquisition

Time efficiency
Time management

Timekeeping

Winner

Workforce planning
Workplace culture
Workplace health and safety

Value Stream Mapping Symbols

Deployment Chart Software

Pyramid Diagram

The vector stencils library "HR symbols" contains 45 HR pictograms.
Use this icon set with HR symbols to draw your HR flowcharts, workflow diagrams, process charts and infographics with the ConceptDraw PRO diagramming and vector drawing software.
The HR pictograms library "HR symbols" is included in the HR Flowcharts solution from the Management area of ConceptDraw Solution Park.
Use this icon set with HR symbols to draw your HR flowcharts, workflow diagrams, process charts and infographics with the ConceptDraw PRO diagramming and vector drawing software.
The HR pictograms library "HR symbols" is included in the HR Flowcharts solution from the Management area of ConceptDraw Solution Park.
Absence management
Absenteeism
Achievement
Attract
Authority and accountability
Business goals
Business success
Capital formation
Career
Career ladder
Communication
Compensation management
Conflict management
Conformance
Dress code
Education
Global HR
Headhunting
Hierarchical organization
Human capital
Human resource management
Incentive compensation management
Increase productivity
Job performance
Job satisfaction
Labor Unions
Leadership
Motivation and incentives
Organizational culture
Partnership
Performance management
Problem solving
Retention
Skill
Smart ideas
Staff turnover
Succession management
Talent acquisition
Time efficiency
Time management
Timekeeping
Winner
Workforce planning
Workplace culture
Workplace health and safety
Business Tools Perceptual Mapping

What is a Quality Management

The vector stencils library "HR symbols" contains 45 HR pictograms.
Use this icon set with HR symbols to draw your HR flowcharts, workflow diagrams, process charts and infographics with the ConceptDraw PRO diagramming and vector drawing software.
The HR pictograms library "HR symbols" is included in the HR Flowcharts solution from the Management area of ConceptDraw Solution Park.
Use this icon set with HR symbols to draw your HR flowcharts, workflow diagrams, process charts and infographics with the ConceptDraw PRO diagramming and vector drawing software.
The HR pictograms library "HR symbols" is included in the HR Flowcharts solution from the Management area of ConceptDraw Solution Park.
Absence management
Absenteeism
Achievement
Attract
Authority and accountability
Business goals
Business success
Capital formation
Career
Career ladder
Communication
Compensation management
Conflict management
Conformance
Dress code
Education
Global HR
Headhunting
Hierarchical organization
Human capital
Human resource management
Incentive compensation management
Increase productivity
Job performance
Job satisfaction
Labor Unions
Leadership
Motivation and incentives
Organizational culture
Partnership
Performance management
Problem solving
Retention
Skill
Smart ideas
Staff turnover
Succession management
Talent acquisition
Time efficiency
Time management
Timekeeping
Winner
Workforce planning
Workplace culture
Workplace health and safety
Process Mapping
SWOT Matrix Template

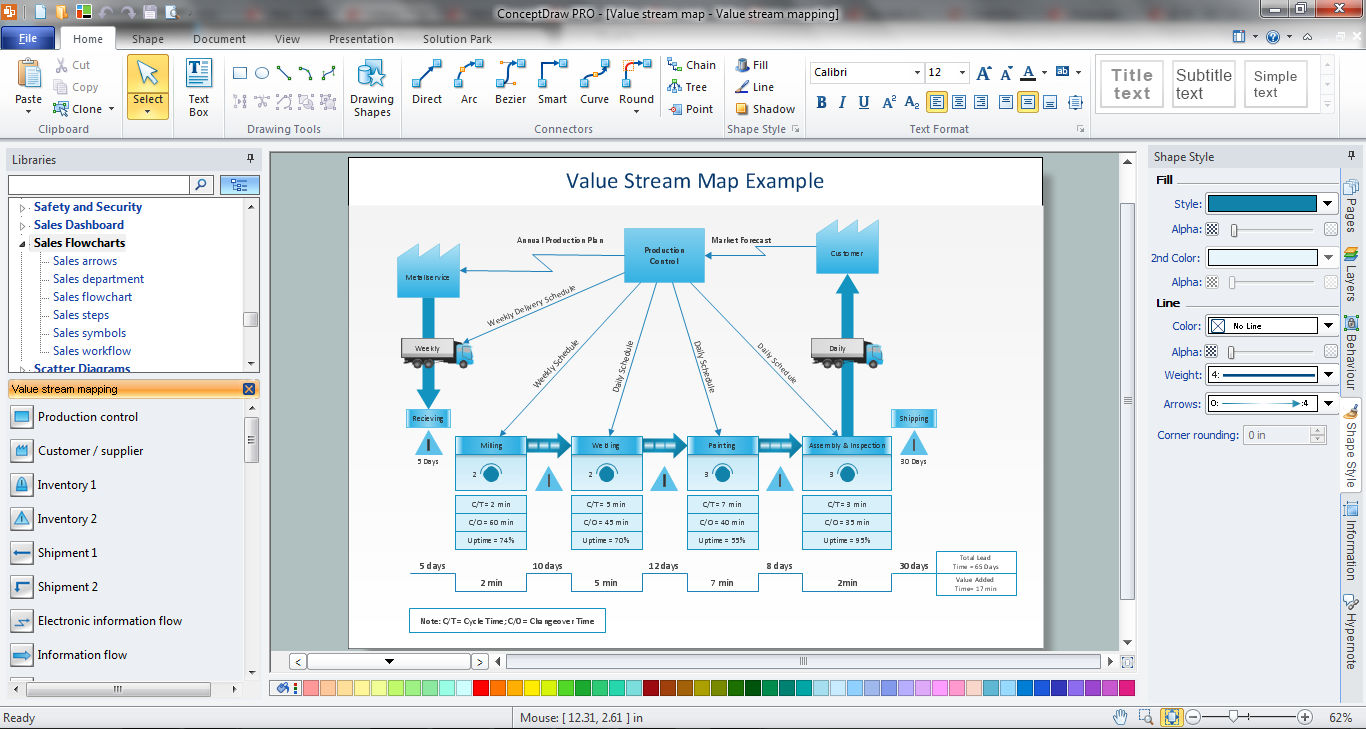
Value Stream Mapping Software
Pyramid Diagram

- Organizational culture - Triangle diagram | Pyramid Diagram ...
- Pyramid Diagram | Organizational culture - Triangle diagram ...
- Organizational culture - Triangle diagram | Pyramid Diagram | How ...
- Organizational culture - Triangle diagram | Pyramid Diagram | HR ...
- Organizational culture - Triangle diagram | Pyramid Diagram | Matrix ...
- Pyramid Organization Symbol Png
- Exploded pie chart - European Parliament election | Organizational ...
- Organizational culture - Triangle diagram | Basketball plays ...
- Organization People Png
- Organizational Structure Types | Office Layout Plans | Glass Pyramid ...
- Triangle Template Png
- Pyramid In Png
- Business Hierarchy Png
- Triangular Pyramid Png
- Pyramid 3d Png
- HR symbols - Vector stencils library | Company's organizational ...
- HR symbols - Vector stencils library | Motivational Man Clipart Png
- Motivation Png Icon
- Skill Png
- Employee Retention Icon Png