"At the base of the identity of an organisational is its organizational culture. A culture is comprised of the shared values, customs, traditions, rituals, behaviours and beliefs shared by a social group (national, ethnic, organizational, etc.). Cultures also share languages, or ways of speaking. From a communication perspective, cultures are made and remade through the words we use to describe our world. Culture represents a common set of values (“shared meanings”), shared by members of a population, a organization, a project/ programme purpose unit or a profession (e.g., engineers versus scientists). Culture change with the times but the speed at which the culture of different institutions change varies widely." [Development Cooperation Handbook/ The development aid organization/ Organizational Culture. Wikibooks]
This organizational culture triangle diagram example derived from Parker and Benson's model. It's for explaination of the Regatta: Adoption Method.
The pyramid diagram example "Organizational culture" was redesigned using the ConceptDraw PRO diagramming and vector drawing software from Wikimedia Commons file Organization_ Triangle.png. [commons.wikimedia.org/ wiki/ File:Organization_ Triangle.png]
This file is licensed under the Creative Commons Attribution-Share Alike 2.5 Generic license. [creativecommons.org/ licenses/ by-sa/ 2.5/ deed.en]
The triangular chart sample "Organizational culture" is included in the Pyramid Diagrams solution from the Marketing area of ConceptDraw Solution Park.
Pyramid diagram

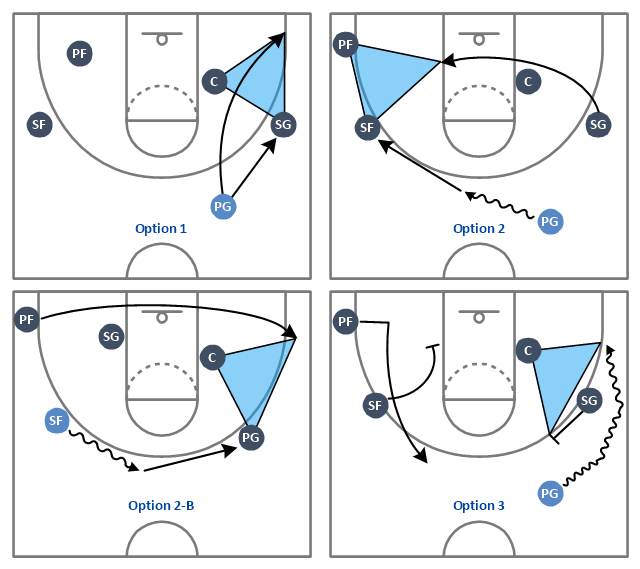
"The triangle offense, also known as the triple-post offense, is an offensive strategy in basketball. Its basic ideas were initially established by Hall of Fame coach Sam Barry at the University of Southern California. His system was later refined by former Houston Rockets and Kansas State University basketball head coach Tex Winter, who played for Barry in the late 1940s. Winter also served as an assistant coach for the Chicago Bulls in the 1980s and 1990s and was also an assistant coach for the Los Angeles Lakers in the 2000s.
The system's most important feature is the sideline triangle created by the center, who stands at the low post, the forward at the wing, and the guard at the corner. The team's other guard stands at the top of the key and the weak-side forward is on the weak-side high post - together forming the "two-man game." The goal of the offense is to fill those five spots, which creates good spacing between players and allows each one to pass to four teammates. Every pass and cut has a purpose and everything is dictated by the defense." [Triangle offense. Wikipedia]
The basketball positions diagram example "Basketball plays - Triangle offense" was created using the ConceptDraw PRO diagramming and vector drawing software extended with the Basketball solution from the Sport area of ConceptDraw Solution Park.
www.conceptdraw.com/ solution-park/ sport-basketball
Basketball positions diagram example
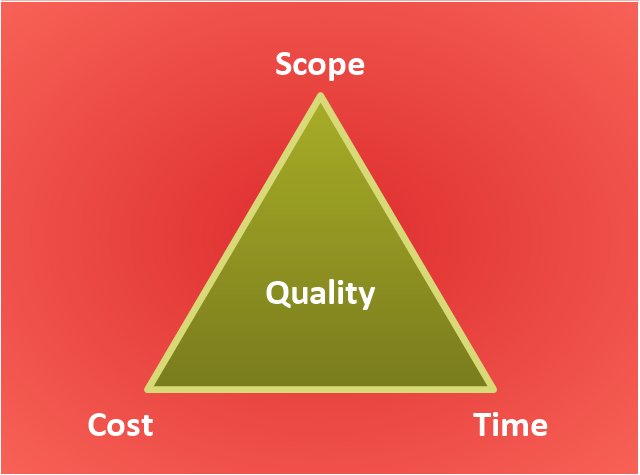
"The Time/ Money/ Quality Triangle illustrates an advertising truism, that "you can't have all three." If there is little time or money, then ad quality will suffer. The more time and/ or money that is available to the project, the higher the quality can be. However, the level of quality must be appropriate to the product...not all products should have high-quality ads!" [Advertising/ Strategies. Wikibooks]
This triangular diagram example was redesigned using the ConceptDraw PRO diagramming and vector drawing software from Wikimedia Commons file Time-Quality-Money.png. [commons.wikimedia.org/ wiki/ File:Time-Quality-Money.png]
This file is licensed under the Creative Commons Attribution-Share Alike 3.0 Unported license. [creativecommons.org/ licenses/ by-sa/ 3.0/ deed.en]
The chart sample "Time, quality, money triangle diagram" is included in the Pyramid Diagrams solution from the Marketing area of ConceptDraw Solution Park.
Triangular chart

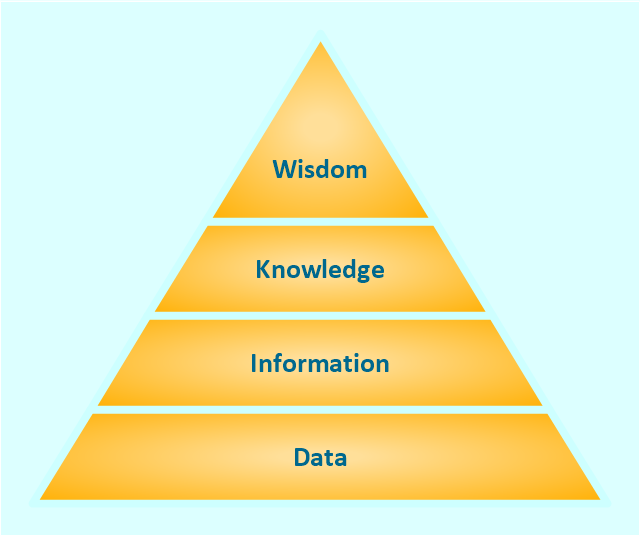
"The DIKW Pyramid, also known variously as the "DIKW Hierarchy", "Wisdom Hierarchy", the "Knowledge Hierarchy", the "Information Hierarchy", and the "Knowledge Pyramid", refers loosely to a class of models for representing purported structural and/ or functional relationships between data, information, knowledge, and wisdom. "Typically information is defined in terms of data, knowledge in terms of information, and wisdom in terms of knowledge"."
[DIKW Pyramid. Wikipedia]
This triangle diagram example of DIKW pyramid has 4 levels: data, information, knowledge and wisdom.
It redesigned using the ConceptDraw PRO diagramming and vector drawing software from Wikimedia Commons file DIKW-diagram.png. [commons.wikimedia.org/ wiki/ File:DIKW-diagram.png]
This file is licensed under the Creative Commons Attribution-Share Alike 3.0 Unported license. [creativecommons.org/ licenses/ by-sa/ 3.0/ deed.en]
The trianglular chart sample "Knowledge hierarchy triangle diagram" is included in the Pyramid Diagrams solution from the Marketing area of ConceptDraw Solution Park.
Pyramid diagram
A four level pyramid model of different types of Information Systems based on the different levels of hierarchy in an organization. The first level represents transaction processing systems for workers. The second level represents management information systems for middle managers. The third level represents decision support systems for senior menegers. The fourth level represents executive information systems for executives.
"The "classic" view of Information systems found in the textbooks in the 1980s was of a pyramid of systems that reflected the hierarchy of the organization, usually transaction processing systems at the bottom of the pyramid, followed by management information systems, decision support systems, and ending with executive information systems at the top. Although the pyramid model remains useful, since it was first formulated a number of new technologies have been developed and new categories of information systems have emerged, some of which no longer fit easily into the original pyramid model.
Some examples of such systems are:
data warehouses,
enterprise resource planning,
enterprise systems,
expert systems,
search engines,
geographic information system,
global information system,
office automation." [Information systems. Wikipedia]
This diagram was redesigned using the ConceptDraw PRO diagramming and vector drawing software from Wikimedia Commons file Four-Level-Pyramid-model.png. [commons.wikimedia.org/ wiki/ File:Four-Level-Pyramid-model.png]
This file is licensed under the Creative Commons Attribution-Share Alike 3.0 Unported license. [creativecommons.org/ licenses/ by-sa/ 3.0/ deed.en]
The triangle chart example "Information systems types" is included in the Pyramid Diagrams solution from the Marketing area of ConceptDraw Solution Park.
Pyramid diagram

A five level pyramid model of different types of Information Systems based on the information processing requirement of different levels in the organization. The first level represents transaction processing systems to process basic data. The second level represents office support systems to process information in office. The third level represents management information systems to process information by managers. The fourth level represents decision support systems to process explicit knowledge. The fifth level represents executive information systems to process tacit knowledge.
"A Computer(-Based) Information System is essentially an IS using computer technology to carry out some or all of its planned tasks. The basic components of computer based information system are:
(1) Hardware - these are the devices like the monitor, processor, printer and keyboard, all of which work together to accept, process, show data and information.
(2) Software - are the programs that allow the hardware to process the data.
(3) Databases - are the gathering of associated files or tables containing related data.
(4) Networks - are a connecting system that allows diverse computers to distribute resources.
(5) Procedures - are the commands for combining the components above to process information and produce the preferred output.
The first four components (hardware, software, database and network) make up what is known as the information technology platform. Information technology workers could then use these components to create information systems that watch over safety measures, risk and the management of data. These actions are known as information technology services." [Information systems. Wikipedia]
This pyramid diagram was redesigned using the ConceptDraw PRO diagramming and vector drawing software from Wikimedia Commons file Five-Level-Pyramid-model.png. [commons.wikimedia.org/ wiki/ File:Five-Level-Pyramid-model.png]
This file is licensed under the Creative Commons Attribution 3.0 Unported license. [creativecommons.org/ licenses/ by/ 3.0/ deed.en]
The triangle chart example "Information systems types" is included in the Pyramid Diagrams solution from the Marketing area of ConceptDraw Solution Park.
Pyramid diagram

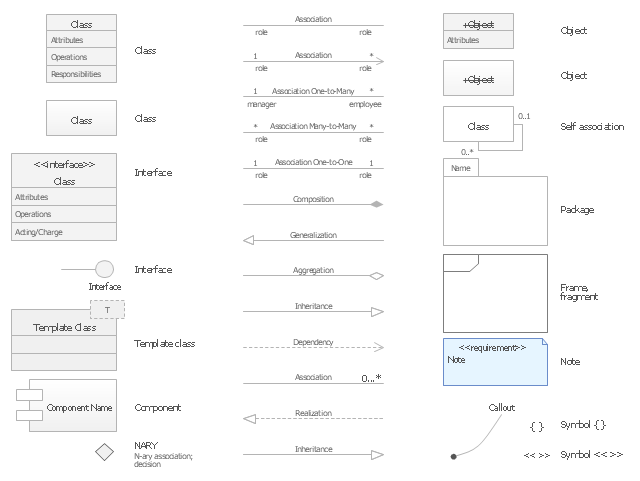
The vector stencils library "UML class diagrams" contains 38 symbols for the ConceptDraw PRO diagramming and vector drawing software.
"... classes are represented with boxes which contain three parts:
(1) The top part contains the name of the class. It is printed in Bold, centered and the first letter capitalized.
(2) The middle part contains the attributes of the class. They are left aligned and the first letter is lower case.
(3) The bottom part gives the methods or operations the class can take or undertake. They are also left aligned and the first letter is lower case. ...
To indicate a classifier scope for a member, its name must be underlined. ...
An association can be named, and the ends of an association can be adorned with role names, ownership indicators, multiplicity, visibility, and other properties. ...
Aggregation ... is graphically represented as a hollow diamond shape on the containing class end of the tree with a single line that connects the contained class to the containing class.
... graphical representation of a composition relationship is a filled diamond shape on the containing class end of the tree of lines that connect contained class(es) to the containing class.
... graphical representation of a Generalization is a hollow triangle shape on the superclass end of the line (or tree of lines) that connects it to one or more subtypes.
... graphical representation of a Realization is a hollow triangle shape on the interface end of the dashed line (or tree of lines) that connects it to one or more implementers. A plain arrow head is used on the interface end of the dashed line that connects it to its users.
Multiplicity ... representation of an association is a line with an optional arrowhead indicating the role of the object(s) in the relationship, and an optional notation at each end indicating the multiplicity of instances of that entity (the number of objects that participate in the association).
Entity classes ... are drawn as circles with a short line attached to the bottom of the circle. Alternatively, they can be drawn as normal classes with the «entity» stereotype notation above the class name." [Class diagram. Wikipedia]
The example "Design elements - UML class diagrams" is included in the Rapid UML solution from the Software Development area of ConceptDraw Solution Park.
UML class diagram symbols
"Crow's Foot notation is used in Barker's Notation, SSADM and Information Engineering. Crow's Foot diagrams represent entities as boxes, and relationships as lines between the boxes. Different shapes at the ends of these lines represent the cardinality of the relationship." [Entity–relationship model. Wikipedia]
The vector stencils library ERD, crow's foot notation contains 17 symbols for creating the ER-diagrams using the ConceptDraw PRO diagramming nd vector drawing software.
The example"Design elements - ERD solution (crow's foot notation)" is included in the Entity-Relationship Diagram (ERD) solution from the Software Development area of ConceptDraw Solution Park.
Crow's foot ERD
.png--diagram-flowchart-example.png)
The vector stencils library "Fire and emergency planning" contains 52 symbols of firefighting equipment.
Use these shapes for drawing fire and emergency floor plans, equipment layouts, and evacuation schemes in the ConceptDraw PRO diagramming and vector drawing software extended with the Fire and Emergency Plans solution from the Building Plans area of ConceptDraw Solution Park.
www.conceptdraw.com/ solution-park/ building-fire-emergency-plans
Direction Arrow
Double Stairs
Stairs

Elevator

Emergency Exit

Handicapped Emergency Exit

Emergency Phone 1

Use Stairs in Fire

Fire Escape or Fire Exit

Black Fire Alarm

Red Fire Alarm

Fire Extinguisher 1

Fire Hose without text

Fire Extinguisher 2

Fire Hose with black text

Fire Hose with red text

First Aid

Left Arrow
Right Arrow
You are here

Biohazard

Radiation Hazard

Obstructions

Hazardous Materials Storage

Sprinkler Connections

Private Fire Detection System

Exits and Entrances

Water Supplies

Elevator Shaft

Nearest Fire Hydrant

Electric Shut Off
Knox Box Location

Water Shut Off
Other Vertical Openings

Roof Access

Gas Shut Off

Emergency Phone 2

Emergency contact information

Fire Alarm

Fire Break Glass

Fire Escape

Danger Compressed Gas

Flammable Material

Oxidant Material

Harmful Chemicals

Non Ionising Radiation

Corrosive Material

High Voltage

Dangerous Chemical

Danger of Death

Fire Point

Fire Blanket

The vector stencils library "Picture Graphs" contains 35 templates of picture bar graphs for visual data comparison and time series.
Drag a template from the library to your document, set bars number, type category labels, select bars and enter your data.
Use these shapes to draw your pictorial bar charts in the ConceptDraw PRO diagramming and vector drawing software.
The vector stencils library "Picture Graphs" is included in the Picture Graphs solution from the Graphs and Charts area of ConceptDraw Solution Park.
Arrow
Water drop

Food

Grain

Agriculture

Medicines

Houses

Buildings

Money bags

Oil barrels

Natural gas

Electrical power

Nuclear power

Mechanical engineering

Chemical industry

Mining

Gold bars

Coins

Person

Men, women and children

Man

Woman

Child

Milk

Meat

Fruits

Vegetables

Computer

Mobile phone

Airliner

Car

Bus

Truck

Train

Cargo ship

"Ecosystems represent sources of natural capital and provide goods and services to society, also called ecosystem services. The Millennium Ecosystem Assessment identified over 24 ecosystem services that can be divided up into 4 general groups including: 1) provisioning, 2) supporting, 3) regulating and 4) cultural." [User:Sawtoothgirl/ Sustainable Real Estate Development. Wikipedia]
"Humankind benefits in a multitude of ways from ecosystems. Collectively, these benefits are known as ecosystem services. Ecosystem services are regularly involved in the provisioning of clean drinking water and the decomposition of wastes. While scientists and environmentalists have discussed ecosystem services implicitly for decades, these the ecosystem services concept itself was popularized by the Millennium Ecosystem Assessment (MA) in the early 2000s. This grouped ecosystem services into four broad categories: provisioning, such as the production of food and water; regulating, such as the control of climate and disease; supporting, such as nutrient cycles and crop pollination; and cultural, such as spiritual and recreational benefits. To help inform decision-makers, many ecosystem services are being assigned economic values." [Ecosystem services. Wikipedia]
The segmented pyramid diagram example "Ecosystem goods and services" was redesigned using the ConceptDraw PRO diagramming and vector drawing software from Wikimedia Commons file ES_ triangle.png.
[commons.wikimedia.org/ wiki/ File:ES_ triangle.png]
This file is licensed under the Creative Commons Attribution-Share Alike 3.0 Unported license. [creativecommons.org/ licenses/ by-sa/ 3.0/ deed.en]
This segmented pyramid diagram example "Ecosystem goods and services" is included in the Pyramid Diagrams solution from the Marketing area of ConceptDraw Solution Park.
Pyramid diagram

"The Project Management Triangle (called also Triple Constraint or the Iron Triangle) is a model of the constraints of project management. It is a graphic aid where the three attributes show on the corners of the triangle to show opposition. It is useful to help with intentionally choosing project biases, or analyzing the goals of a project. It is used to illustrate that project management success is measured by the project team's ability to manage the project, so that the expected results are produced while managing time and cost." [Project management triangle. Wikipedia]
The pyramid chart example "Project management triangle diagram" was redesigned using the ConceptDraw PRO diagramming and vector drawing software from Wikimedia Commons file Project-triangle-en.svg. [commons.wikimedia.org/ wiki/ File:Project-triangle-en.svg]
The project management triangle chart example is included in the Pyramid Diagrams solution from the Marketing area of ConceptDraw Solution Park.
Pyramid diagram
Use this triangular pyramid chart template to create your own marketing triangle diagrams using the ConceptDraw PRO diagramming and vector drawing software.
The Triangular pyramid diagram template is included in the Pyramid Diagrams solution from the Marketing area of ConceptDraw Solution Park.
www.conceptdraw.com/ solution-park/ marketing-pyramid-diagrams
The Triangular pyramid diagram template is included in the Pyramid Diagrams solution from the Marketing area of ConceptDraw Solution Park.
www.conceptdraw.com/ solution-park/ marketing-pyramid-diagrams
Triangle chart

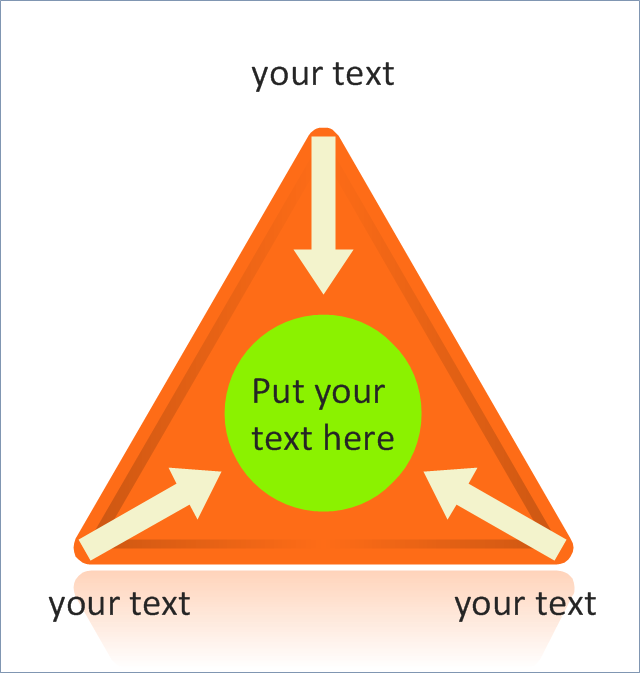
Use this triangle chart template to create your own marketing triangular schemes using the ConceptDraw PRO diagramming and vector drawing software.
The template "Triangle scheme with arrows" is included in the Pyramid Diagrams solution from the Marketing area of ConceptDraw Solution Park.
www.conceptdraw.com/ solution-park/ marketing-pyramid-diagrams
The template "Triangle scheme with arrows" is included in the Pyramid Diagrams solution from the Marketing area of ConceptDraw Solution Park.
www.conceptdraw.com/ solution-park/ marketing-pyramid-diagrams
Triangle chart with arrows
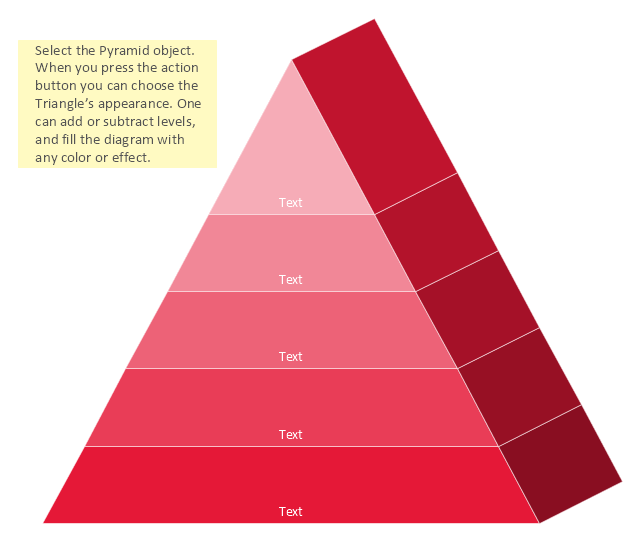
3D Triangle diagrams visualize the relationship building blocks as a triangle divided into horizontal slices, and may be oriented up or down. Labeled slices represent a hierarchy. They are used in marketing presentations to show and analyze hierarchy levels.
This 3D triangular diagram template for the ConceptDraw PRO diagramming and vector drawing software is included in the Pyramid Diagrams solution from the Marketing area of ConceptDraw Solution Park.
This 3D triangular diagram template for the ConceptDraw PRO diagramming and vector drawing software is included in the Pyramid Diagrams solution from the Marketing area of ConceptDraw Solution Park.
3D Triangular diagram
- Diagram Template Png
- Pyramid Diagram | Time, quality, money triangle diagram | Currency ...
- Orange Triangle Png
- Truck Vector Png
- Pyramid Diagram | Time, quality, money triangle diagram | Time ...
- Plane Illustration Png
- Triangle Png Icon
- ADS Png
- Pentagon Png
- Pyramid Diagram | Time, quality, money triangle diagram | Currency ...
- Information System Png
- Goods And Services Png
- Pink Oval Vectors Png
- Collapse Symbol Png
- Pyramid Template 3d Png
- Full Moon Png
- Hierarchy of laws | Typography Art | Pyramid Diagram | Png ...
- Relationship Marketing Png
- Square Box Png
- Decision Png