Process Flowchart


How to Draw a Line Graph

 Fishbone Diagram
Fishbone Diagrams solution extends ConceptDraw PRO software with templates, samples and library of vector stencils for drawing the Ishikawa diagrams for cause and effect analysis.
This cause and effect diagram sample was redesigned from the Wikimedia Commons file: Ursache Wirkung Diagramm Beispiel.png. [commons.wikimedia.org/ wiki/ File:Ursache_ Wirkung_ Diagramm_ Beispiel.png]
This file is licensed under the Creative Commons Attribution-Share Alike 3.0 Unported license. [creativecommons.org/ licenses/ by-sa/ 3.0/ deed.en]
"Productivity is the ratio of output to inputs in production; it is an average measure of the efficiency of production. Efficiency of production means production’s capability to create incomes which is measured by the formula real output value minus real input value.
Productivity is a crucial factor in production performance of firms and nations. Increasing national productivity can raise living standards because more real income improves people's ability to purchase goods and services, enjoy leisure, improve housing and education and contribute to social and environmental programs. Productivity growth also helps businesses to be more profitable." [Productivity. Wikipedia]
The fishbone diagram example "Increase in productivity" was created using the ConceptDraw PRO diagramming and vector drawing software extended with the Fishbone Diagrams solution from the Management area of ConceptDraw Solution Park.
Ishikawa diagram

How to Construct a Fishbone Diagram

Venn Diagram Examples for Problem Solving. Environmental Social Science. Human Sustainability Confluence

Cause and Effect Diagram Software

Chart Maker for Presentations

Lean Manufacturing Diagrams
 design elements")
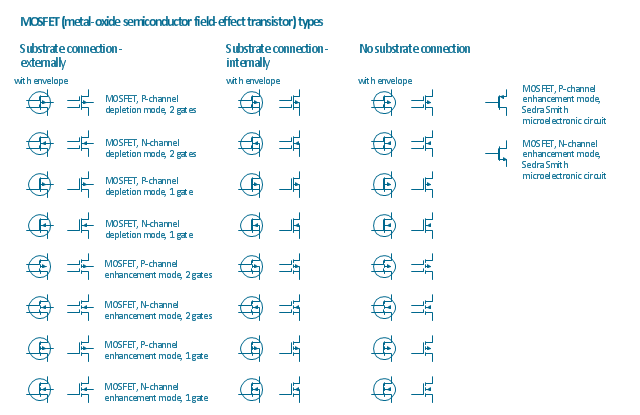
The vector stencils library "MOSFET" contains 18 symbols of MOSFET (metal–oxide–semiconductor field-effect transistor) elements for drawing electronic circuits diagrams.
"A variety of symbols are used for the MOSFET. The basic design is generally a line for the channel with the source and drain leaving it at right angles and then bending back at right angles into the same direction as the channel. Sometimes three line segments are used for enhancement mode and a solid line for depletion mode. ... Another line is drawn parallel to the channel for the gate.
The "bulk" or "body" connection, if shown, is shown connected to the back of the channel with an arrow indicating PMOS or NMOS. Arrows always point from P to N, so an NMOS (N-channel in P-well or P-substrate) has the arrow pointing in (from the bulk to the channel). If the bulk is connected to the source (as is generally the case with discrete devices) it is sometimes angled to meet up with the source leaving the transistor. If the bulk is not shown (as is often the case in IC design as they are generally common bulk) an inversion symbol is sometimes used to indicate PMOS, alternatively an arrow on the source may be used in the same way as for bipolar transistors (out for nMOS, in for pMOS). ...
For the symbols in which the bulk, or body, terminal is shown, it is here shown internally connected to the source... This is a typical configuration, but by no means the only important configuration. In general, the MOSFET is a four-terminal device, and in integrated circuits many of the MOSFETs share a body connection, not necessarily connected to the source terminals of all the transistors." [MOSFET. Wikipedia]
The symbols example "Design elements - MOSFET" was drawn using the ConceptDraw PRO diagramming and vector drawing software extended with the Electrical Engineering solution from the Engineering area of ConceptDraw Solution Park.
MOSFET symbols
 Health Food
The Health Food solution contains the set of professionally designed samples and large collection of vector graphic libraries of healthy foods symbols of fruits, vegetables, herbs, nuts, beans, seafood, meat, dairy foods, drinks, which give powerful possi
Fishbone Problem Solving

 Fishbone Diagrams
The Fishbone Diagrams solution extends ConceptDraw PRO v10 software with the ability to easily draw the Fishbone Diagrams (Ishikawa Diagrams) to clearly see the cause and effect analysis and also problem solving. The vector graphic diagrams produced using this solution can be used in whitepapers, presentations, datasheets, posters, and published technical material.
Cause and Effect Diagram

HelpDesk
How to Add and Edit Text on Connectors

- Pyramid Diagram | DroidDia prime | Process Flowchart | Png Line
- Png Background Effect
- Lighting Png
- Electrical Lighting Symbols Png
- Lighting Symbol Png
- Line Diagram Png
- Map of median household income in Australia | Cause and effect ...
- Line Abstract Png
- Creative Cause And Effect Diagram Png
- Cause and effect diagram - Increase in productivity | Porter five ...
- Cause and effect diagram - Increase in productivity | Process ...
- Security Plans | Chemistry Symbols and Meanings | Basic Line ...
- Flowchart design. Flowchart symbols, shapes, stencils and icons ...
- Horizontal Line With Down Arrow Png
- Png Earthquake Effect
- Economics Png
- Instagram Vector Png
- Effects Png
- Fishbone Png
- Fishbone Diagram Png