Flow Chart Symbols

Block Diagram

Functional Block Diagram

Hybrid Network Topology

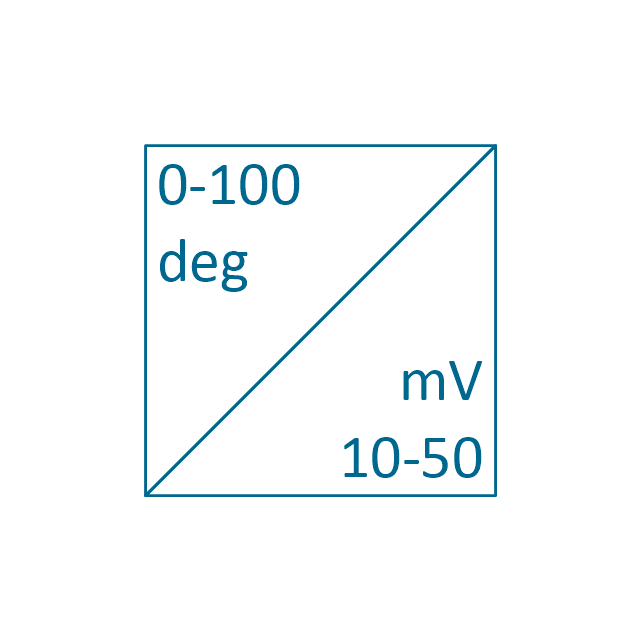
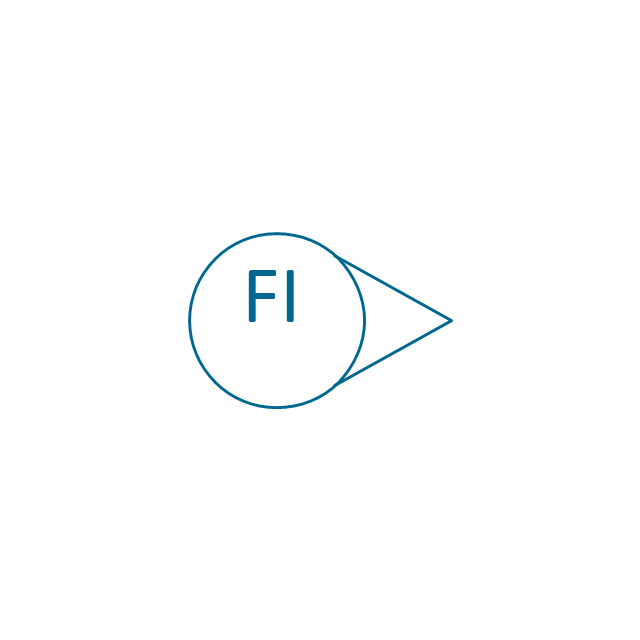
The vector stencils library "Instruments" contains 72 symbols of control instruments and measuring devices: meters and gauges, and callouts, text boxes, and inserts.
Use these shapes to create annotated process flow diagrams (PFD), flow control, manufacturing processes, and distribution system diagrams in the ConceptDraw PRO software extended with the Chemical and Process Engineering solution from the Chemical and Process Engineering area of ConceptDraw Solution Park.
www.conceptdraw.com/ solution-park/ engineering-chemical-process
Indicator local

Indicator remote
Indicator auxiliary
CRT local
CRT remote
CRT auxiliary
PLC local

PLC auxiliary

PLC remote

Computer local
Computer auxiliary

Computer remote

Light local

Light remote
Light auxiliary
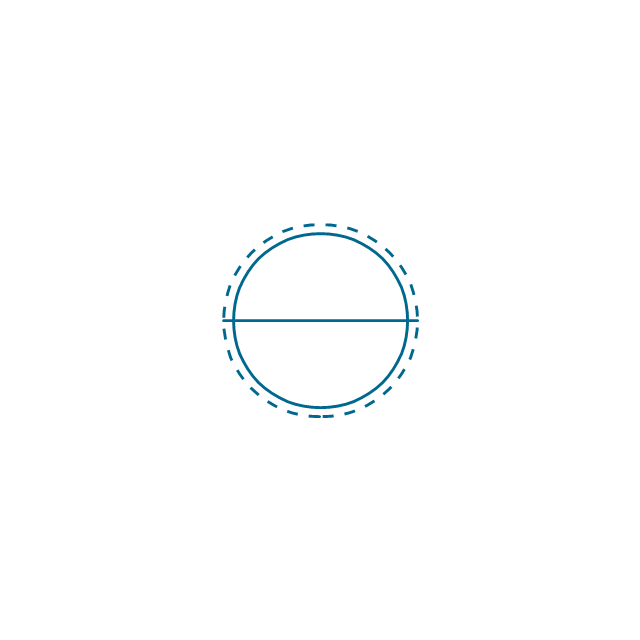
Indicator auxiliary (dashed)
-instruments---vector-stencils-library.png--diagram-flowchart-example.png)
Indicator remote (dashed)
-instruments---vector-stencils-library.png--diagram-flowchart-example.png)
Steam traced auxiliary

Steam traced remote
Steam traced local

Level meter auxiliary
Level meter remote
Level meter local
Pressure gauge diaphragm
Pressure gauge
Pressure gauge liquid filled
Strain gauge
Thermometer bi-metallic

Thermometer gas
Thermometer general

Thermometer glass

Thermometer liquid
Thermometer resistance
Thermometer thermocouple
Flowmeter electromagnetic
Flowmeter general

Flowmeter nozzle
Flowmeter orifice
Flowmeter positive displacement
Flowmeter turbine

Flowmeter variable area
Flowmeter Venturi

Level meter capacitive
Level meter conductive
Level meter displacer

Level meter float
Level meter general

Level meter sonic

Indicator analoque

Indicator digital
Indicator general

Recorder analoque
Recorder digital
Recorder general
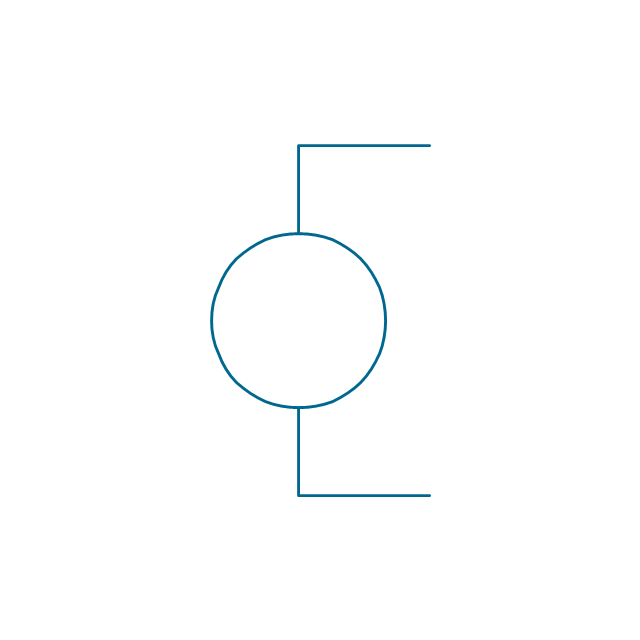
Converter
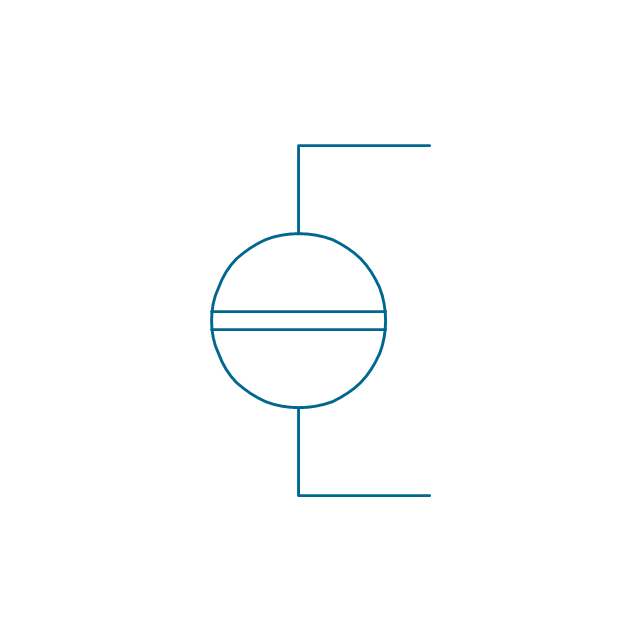
Converter 2 (1st half filled)
-instruments---vector-stencils-library.png--diagram-flowchart-example.png)
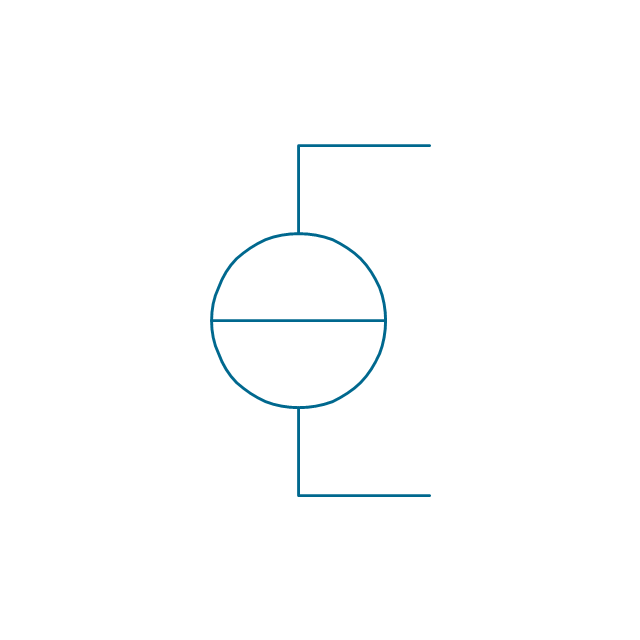
Converter 3 (2nd half filled)
-instruments---vector-stencils-library.png--diagram-flowchart-example.png)
Venturi

Venturi (pressure taps)
-instruments---vector-stencils-library.png--diagram-flowchart-example.png)
Flowmeter

Rotameter
Vortex sensor

Propeller meter

Generic utility

Operator box

Operator box 2 (1st half filled)
-instruments---vector-stencils-library.png--diagram-flowchart-example.png)
Operator box 3 (2nd half filled)
-instruments---vector-stencils-library.png--diagram-flowchart-example.png)
AND gate

OR gate

NOT gate

Correcting element

Diamond

SWOT Sample in Computers

Technical Drawing Software

"Product life cycle is a business analysis that attempts to identify a set of common stages in the life of commercial products. In other words the 'Product Life cycle' PLC is used to map the lifespan of the product such as the stages through which a product goes during its lifespan. ...
The stages of a product's life cycle... :
1. INTRODUCTION... 2. GROWTH... 3. MATURITY... 4. DECLINE...
The product life cycle is an important concept in marketing. It includes four stages that a product goes through from when it was first thought of until it is eliminated from the industry. Not all products reach this final stage. Some continue to grow and others rise and fall." [Product lifecycle. Wikipedia]
The flow chart example "Product life cycle process" was created using the ConceptDraw PRO diagramming and vector drawing software extended with the Flowcharts solution from the area "What is a Diagram" of ConceptDraw Solution Park.
Flowchart - Product life cycle process

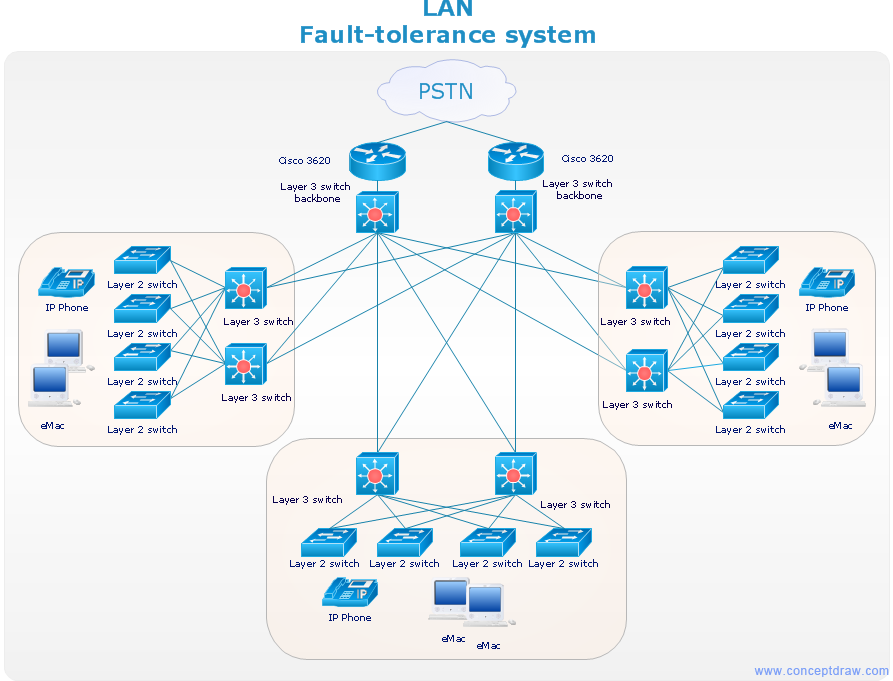
Network Diagrams for Bandwidth Management

 Marketing Diagrams
Marketing Diagrams solution extends ConceptDraw DIAGRAM diagramming software with abundance of samples, templates and vector design elements intended for easy graphical visualization and drawing different types of Marketing diagrams and graphs, including Branding Strategies Diagram, Five Forces Model Diagram, Decision Tree Diagram, Puzzle Diagram, Step Diagram, Process Chart, Strategy Map, Funnel Diagram, Value Chain Diagram, Ladder of Customer Loyalty Diagram, Leaky Bucket Diagram, Promotional Mix Diagram, Service-Goods Continuum Diagram, Six Markets Model Diagram, Sources of Customer Satisfaction Diagram, etc. Analyze effectively the marketing activity of your company and apply the optimal marketing methods with ConceptDraw DIAGRAM software.
- Product life cycle process - Flowchart | Plc Process Flow Chart
- Purchase Process Flow Chart , Receiving Process Flow Chart ...
- Product life cycle graph | Purchase Process Flow Chart , Receiving ...
- Block Diagram | Daisy Chain Network Topology | Purchase Process ...
- Process Flowchart | What is the Accounting Cycle? | Block Diagrams ...
- Plc Stages Flow Chart
- Credit approval process - Cross-functional flowchart | Flow Chat Of ...
- Product life cycle graph | Product life cycle process - Flowchart ...
- How to Add a Block Diagram to a MS Word ™ Document Using ...