Sample Pictorial Chart. Sample Infographics
")
HelpDesk
How to Draw a Pictorial Chart in ConceptDraw PRO

How to Draw Pictorial Chart. How to Use Infograms

Pictorial Chart

Basic Diagramming


Design Pictorial Infographics. Design Infographics

Infographic Maker

Tools to Create Your Own Infographics

Process Flowchart


Best Program to Make Workflow Diagrams

This pictorial chart sample shows the population growth by continent in 2010-2013.
"Population growth' refers to the growth in human populations. Global population growth is around 80 million annually, or 1.2% p.a. The global population has grown from 1 billion in 1800 to 7 billion in 2012. It is expected to keep growing to reach 11 billion by the end of the century. Most of the growth occurs in the nations with the most poverty, showing the direct link between high population growth and low standards of living. The nations with high standards of living generally have low or zero rates of population growth. Australia's population growth is around 400,000 annually, or 1.8% p.a., which is nearly double the global average. It is caused mainly by very high immigration of around 200,000 p.a., the highest immigration rate in the world. Australia remains the only nation in the world with both high population growth and high standards of living." [Population growth. Wikipedia]
The image chart example "Population growth by continent, 2010 - 2013" was created using the ConceptDraw PRO diagramming and vector drawing software extended with the Basic Picture Graphs solution from the Graphs and Charts area of ConceptDraw Solution Park.
Image chart

Basic Flowchart Symbols and Meaning


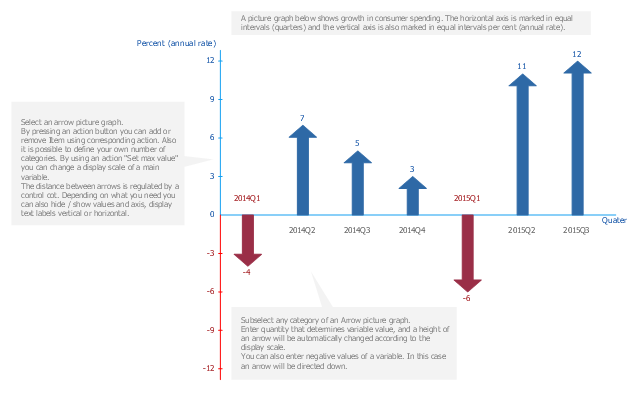
A picture chart (image chart, pictorial graph) is the type of a bar graph visualizing numarical data using symbols and pictograms.
In the field of economics and finance use a picture graph with columns in the form of coins. For population comparison statistics use a chart with columns in the form of manikins. To show data increase or decrease use arrows bar charts.
The arrow chart template "Picture graph" for the ConceptDraw PRO diagramming and vector drawing software is included in the Basic Picture Graphs solution from the Graphs and Charts area of ConceptDraw Solution Park.
Arrows bar graph template
Business Report Pie. Pie Chart Examples

- Sample Pictorial Chart . Sample Infographics
- Design Pictorial Infographics. Design Infographics | Sample Pictorial ...
- How to Draw a Pictorial Chart in ConceptDraw PRO | How to Draw ...
- Sample Pictorial Chart . Sample Infographics | Pictorial Chart | Line ...
- Sample Pictorial Chart . Sample Infographics | How to Draw Pictorial ...
- Sample Pictorial Chart . Sample Infographics | Pie Donut Chart . Pie ...
- Sample Pictorial Chart . Sample Infographics | Design Pictorial ...
- Sample Pictorial Chart . Sample Infographics | How to Draw a ...
- Sample Pictorial Chart . Sample Infographics | Infographic Maker ...
- Pictorial Chart | Infographic Maker | Sample Pictorial Chart . Sample ...
- Information Graphics | Sample Pictorial Chart . Sample Infographics ...
- Basic Diagramming | Sample Pictorial Chart . Sample Infographics ...
- How to Draw Pictorial Chart . How to Use Infograms | Sample ...
- Sample Pictorial Chart . Sample Infographics | Basic Flowchart ...
- Sample Pictorial Chart . Sample Infographics | Geo Map - South ...
- Sample Pictorial Chart . Sample Infographics | Pictorial Chart | Basic ...
- Example Of Pictorial Chart
- Basic Flowchart Symbols and Meaning | Sample Pictorial Chart ...
- Basic Diagramming | Sample Pictorial Chart . Sample Infographics ...
- Process Flowchart | Sample Pictorial Chart . Sample Infographics ...