Basic Flowchart Symbols and Meaning
Flowcharts are the best for visually representation the business processes and the flow of a custom-order process through various departments within an organization. ConceptDraw PRO diagramming and vector drawing software extended with Flowcharts solution offers the full set of predesigned basic flowchart symbols which are gathered at two libraries: Flowchart and Flowcharts Rapid Draw. Among them are: process, terminator, decision, data, document, display, manual loop, and many other specific symbols. The meaning for each symbol offered by ConceptDraw gives the presentation about their proposed use in professional Flowcharts for business and technical processes, software algorithms, well-developed structures of web sites, Workflow diagrams, Process flow diagram and correlation in developing on-line instructional projects or business process system. Use of ready flow chart symbols in diagrams is incredibly useful - you need simply drag desired from the libraries to your document and arrange them in required order. There are a few serious alternatives to Visio for Mac, one of them is ConceptDraw PRO. It is one of the main contender with the most similar features and capabilities.
Sample Pictorial Chart. Sample Infographics
Sample Pictorial Chart - Pictorial Infographics solution provides easy-to-use design infographics drawing tools, large collection of different sample infographics and infograms, sample pictorial chart and templates to be filled in, and 10 libraries with great quantity of predesigned vector pictograms. Use Pictorial Infographics solution to draw your own design pictorial infographics documents quick and easy.Local area network (LAN). Computer and Network Examples
Local Area Network (LAN) is a network which consists of computers and peripheral devices connected each other and to the local domain server, and covers a little territory or small number of buildings, such as home, school, laboratory, office, etc. LAN serves for few hundreds of users. It includes many cables and wires, and demands to design previously a Network diagram. All local area network devices can use the shared printers and disk storage. ConceptDraw PRO is a perfect network diagramming software with examples of LAN Diagrams, templates and predesigned vector objects. ConceptDraw PRO is the ideal choice for network engineers and network designers who need to draw fast and easy Local Area Network Diagrams, for IT specialists, developers and other IT professionals which need to visualize the communication schemes of LAN and visually document the LAN's physical structure and arrangement in houses, offices and other buildings. Ready-to-use vector objects from Computer Network Diagrams solution will help you design LAN diagrams in minutes.
Tools to Create Your Own Infographics
Over the past few centuries, data visualization has evolved so much that we use it every day in all areas of our lives. Many believe that infographic is an effective tool of storytelling, as well as analytics, and that it is able to overcome most of the language and educational barriers. Understanding the mechanisms of human perception will help you to understand how abstract forms and colors used in data visualization can transmit information more efficient than long paragraphs of text.
 Presentation Exchange
This solution extends ConceptDraw MINDMAP software with the ability to import presentations from Microsoft PowerPoint, as well as enhancing its existing presentation capabilities.
 Spatial Infographics
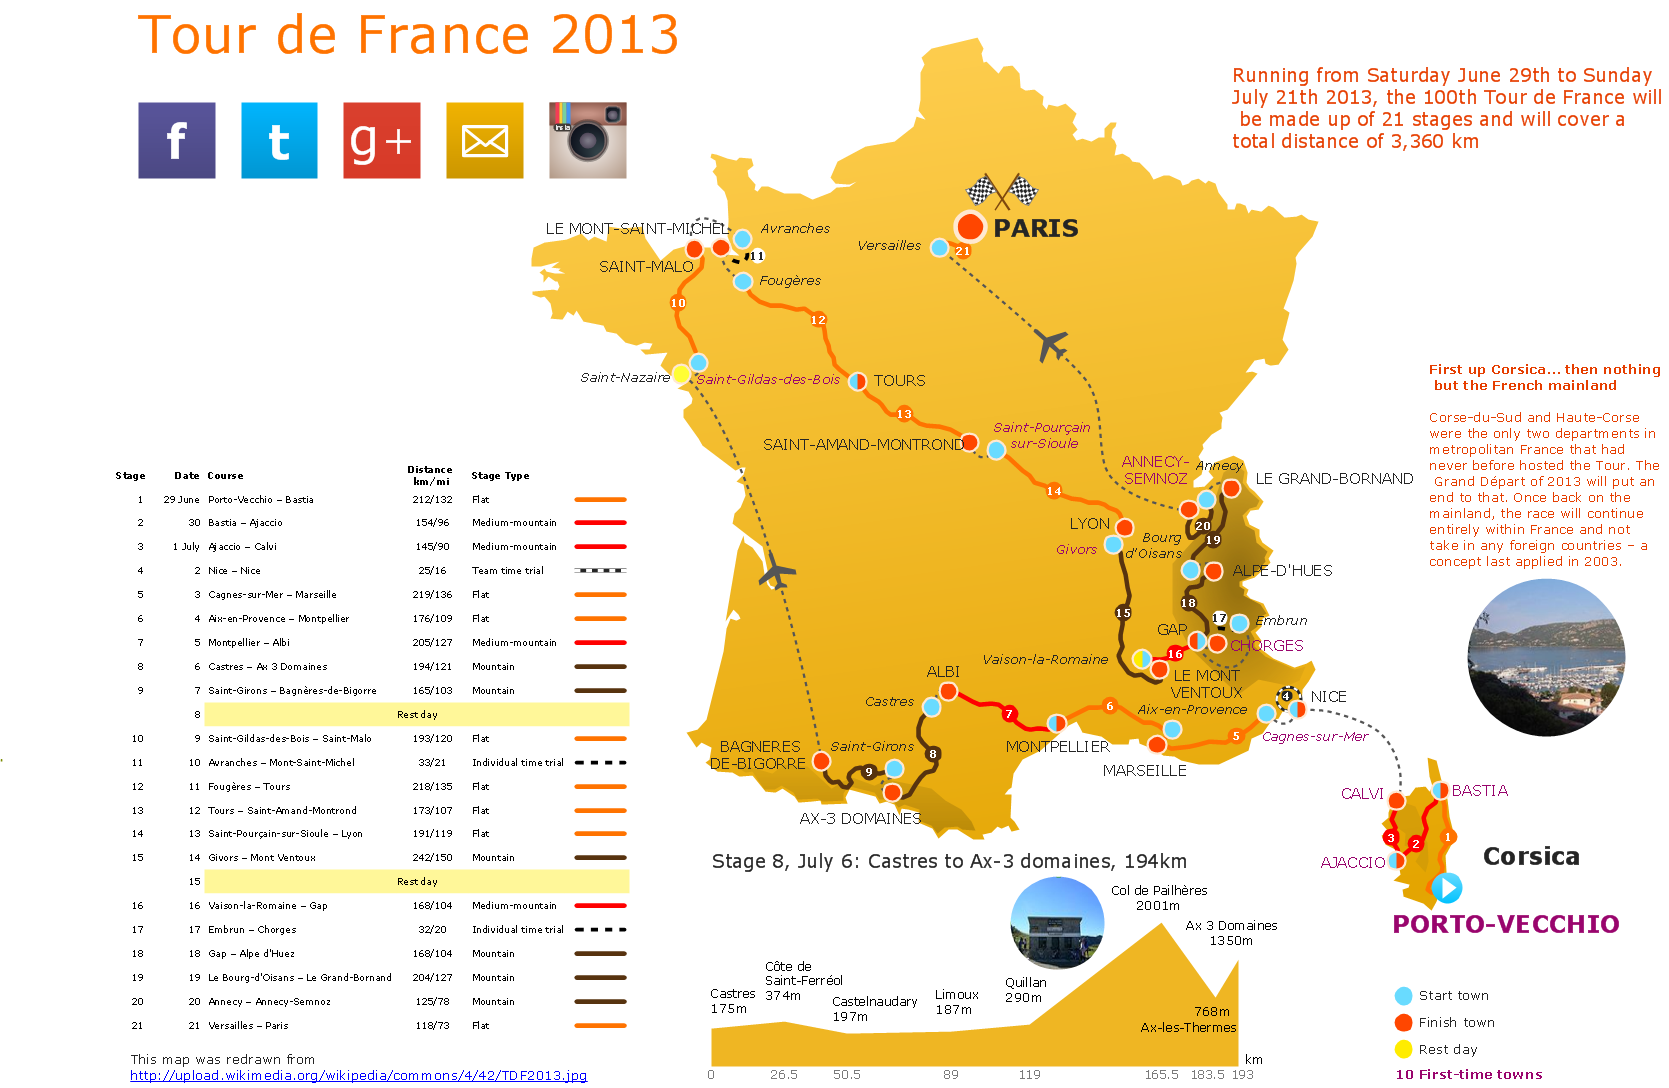
Spatial infographics solution extends ConceptDraw PRO software with infographic samples, map templates and vector stencils libraries with design elements for drawing spatial information graphics.
Travel Infographics
Creating Travel infographics is super-easy with ConceptDraw.- Pictorial Graph In Extension
- Pictorial Chart | Pictorial concepts - Clip art | Remote Presentation ...
- Pictorial Diagram Of An Organizational Chart Of An Office
- Bar Chart Pictorial Are Diagram Or Not
- How to Draw Pictorial Chart . How to Use Infograms | ConceptDraw ...
- The Pictorial Picture Bar Chart And Histogram
- Physics | Histograms | ConceptDraw Solution Park | Pictorial ...
- How to Draw Pictorial Chart . How to Use Infograms | Basic Flowchart ...
- How to Draw Pictorial Chart . How to Use Infograms | Design Pictorial ...
- Pictorial Flow Chart Of The Program
- How to Draw a Pictorial Chart in ConceptDraw PRO | Process ...
- Pictorial Chart Sketch
- Pictorial Graph
- Basic Flowchart Symbols and Meaning | Flow chart Example ...
- How to Draw a Pictorial Chart in ConceptDraw PRO | Process ...
- How to Draw a Pictorial Chart in ConceptDraw PRO | Sample ...
- Bar Diagram Math | Chart Software for Better Presentations | Divided ...
- Organisational Process Charts In Extension
- Pictorial Diagram Representation Of Flow Charts
- Solve Pie Chart Graph Ana Diagrams With Picture


