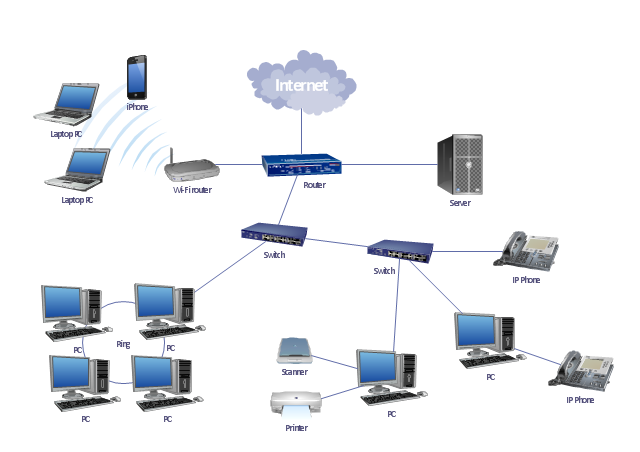
"A local area network (LAN) is a computer network that interconnects computers in a limited area such as a home, school, computer laboratory, or office building using network media. The defining characteristics of LANs, in contrast to wide area networks (WANs), include their smaller geographic area, and non-inclusion of leased telecommunication lines. Ethernet over twisted pair cabling, and Wi-Fi are the two most common technology standards currently used to build LANs." [Local area network. Wikipedia]
This local area network (LAN) topology diargam example was created using the ConceptDraw PRO diagramming and vector drawing software extended with the Computer and Networks solution from the Computer and Networks area of ConceptDraw Solution Park.
This local area network (LAN) topology diargam example was created using the ConceptDraw PRO diagramming and vector drawing software extended with the Computer and Networks solution from the Computer and Networks area of ConceptDraw Solution Park.
LAN topology diagram
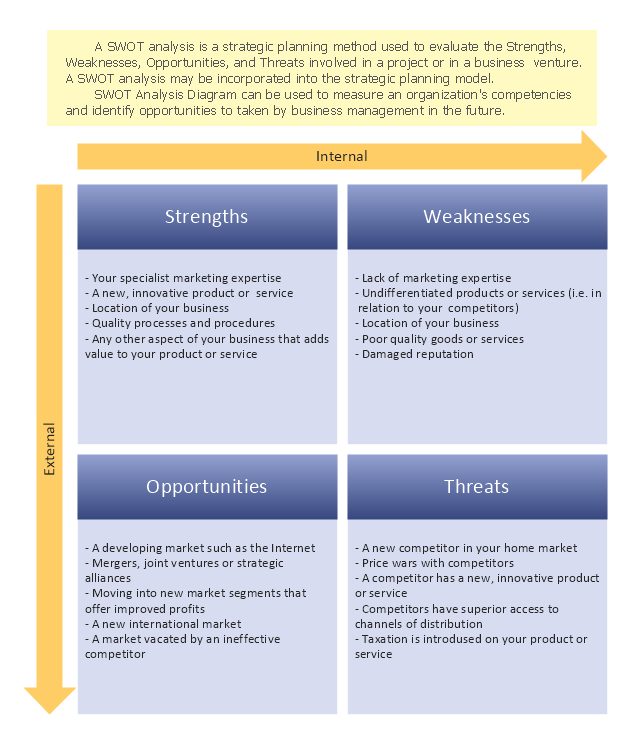
SWOT analysis is a strategic planning method for evaluation of Strengths, Weaknesses, Opportunities, and Threats of a project or a business venture. It may be the part of strategic planning model. SWOT Diagrams are used to measure an organization's competencies and identify opportunities to taken by management in the future.
This SWOT analysis matrix diagram template for the ConceptDraw PRO diagramming and vector drawing software is included in the SWOT Analysis solution from the Management area of ConceptDraw Solution Park.
This SWOT analysis matrix diagram template for the ConceptDraw PRO diagramming and vector drawing software is included in the SWOT Analysis solution from the Management area of ConceptDraw Solution Park.
SWOT matrix template
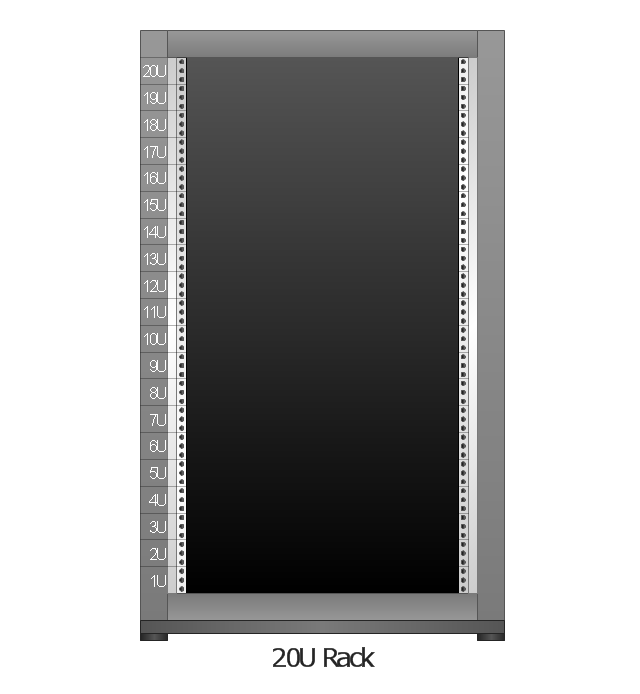
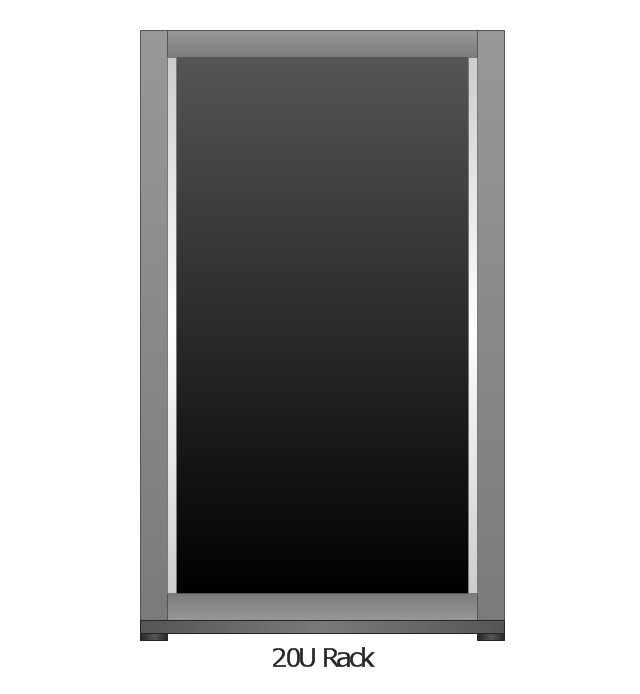
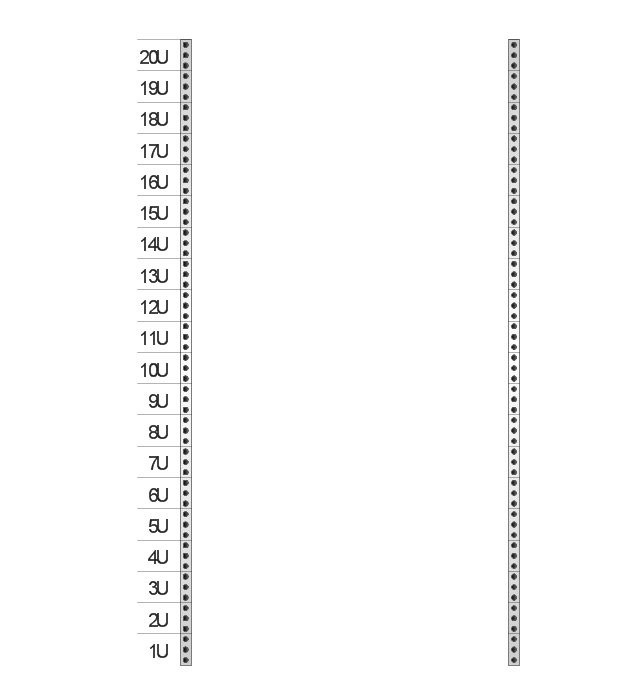
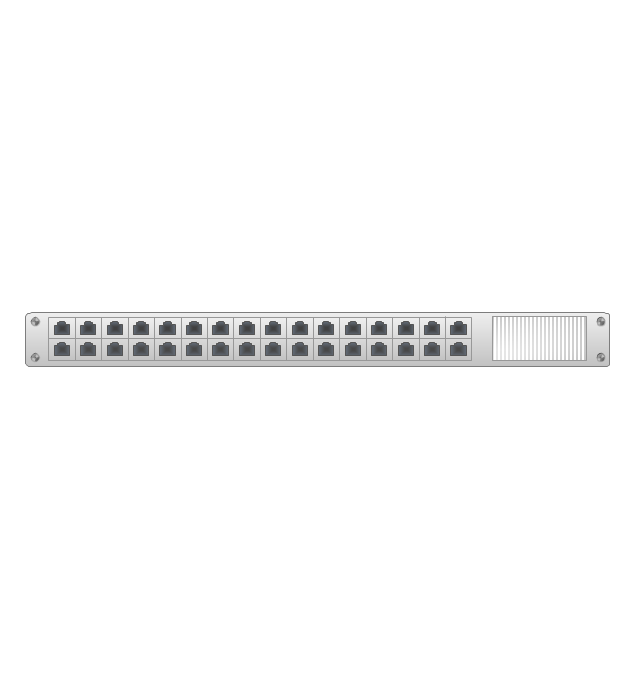
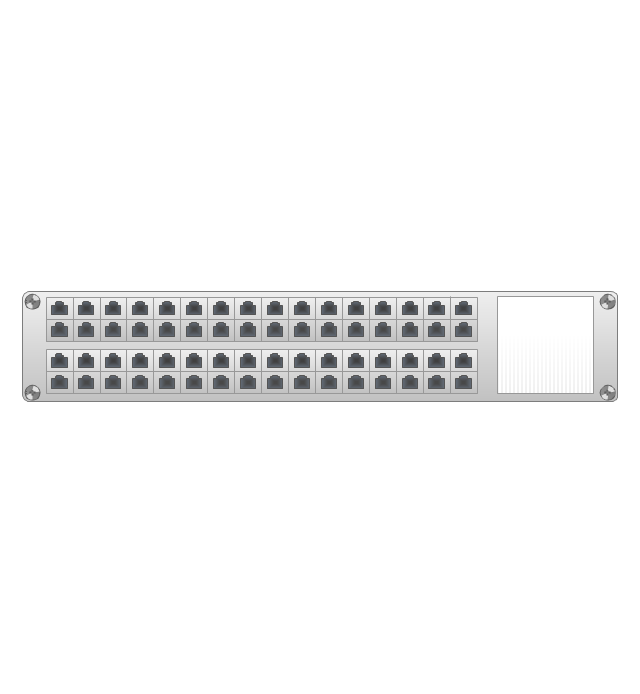
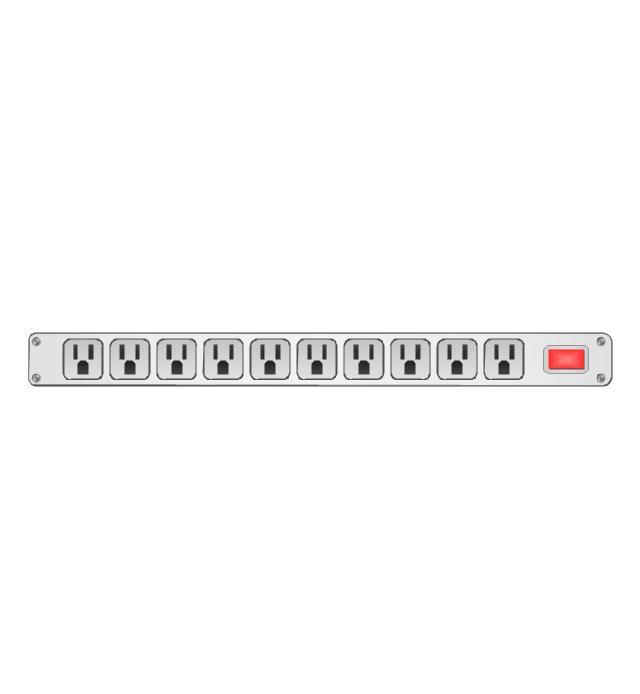
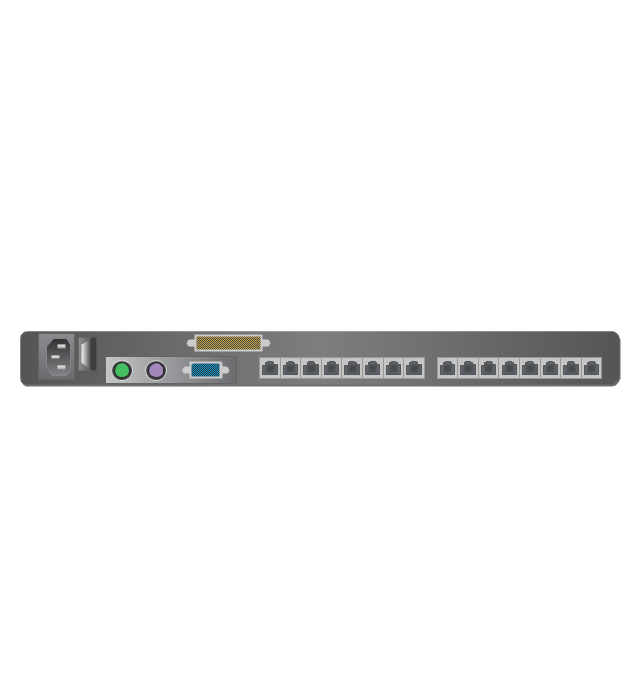
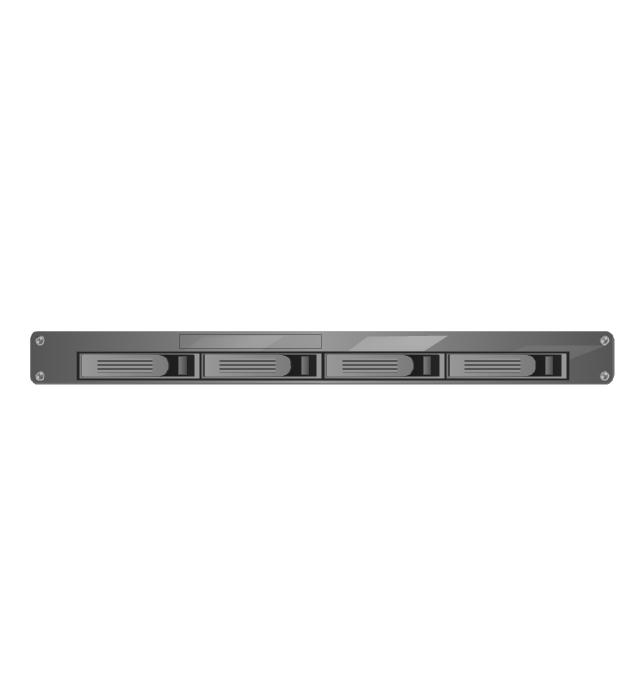
The vector stencils library "Rack diagrams" contains 33 rack design elements for drawing the computer network server rack diagrams.
"A 19-inch rack is a standardized frame or enclosure for mounting multiple equipment modules. Each module has a front panel that is 19 inches (482.6 mm) wide, including edges or ears that protrude on each side which allow the module to be fastened to the rack frame with screws. ...
Equipment designed to be placed in a rack is typically described as rack-mount, rack-mount instrument, a rack mounted system, a rack mount chassis, subrack, rack mountable, or occasionally simply shelf. The height of the electronic modules is also standardized as multiples of 1.75 inches (44.45 mm) or one rack unit or U (less commonly RU). The industry standard rack cabinet is 42U tall. ...
19-inch racks in 2-post or 4-post form hold most equipment in modern data centers, ISP facilities and professionally designed corporate server rooms. They allow for dense hardware configurations without occupying excessive floorspace or requiring shelving." [19-inch rack. Wikipedia]
The clip art example "Rack diagrams - Vector stencils library" was created using the ConceptDraw PRO diagramming and vector drawing software extended with the Rack Diagrams solution from the Computer and Networks area of ConceptDraw Solution Park.
19 inch Rack with Rails
Rack
Rack rails
Rack rails (half-width)
-rack-diagrams---vector-stencils-library.png--diagram-flowchart-example.png)
Single rack rail

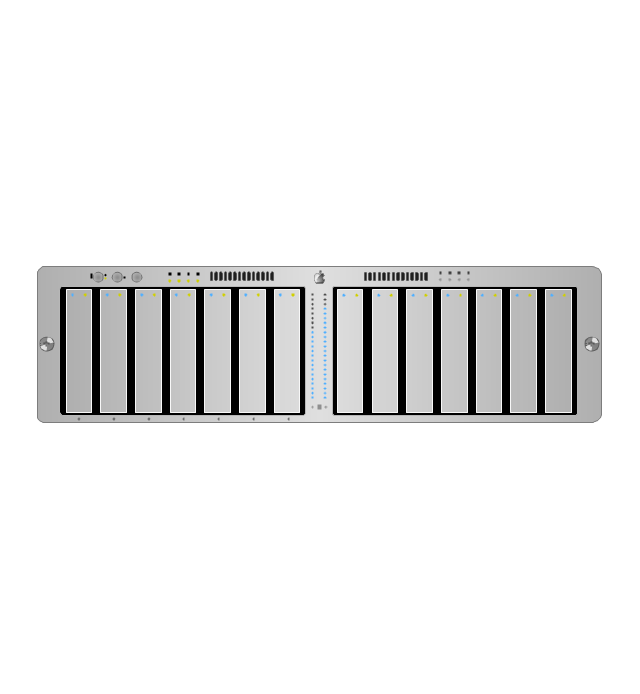
Xserve RAID
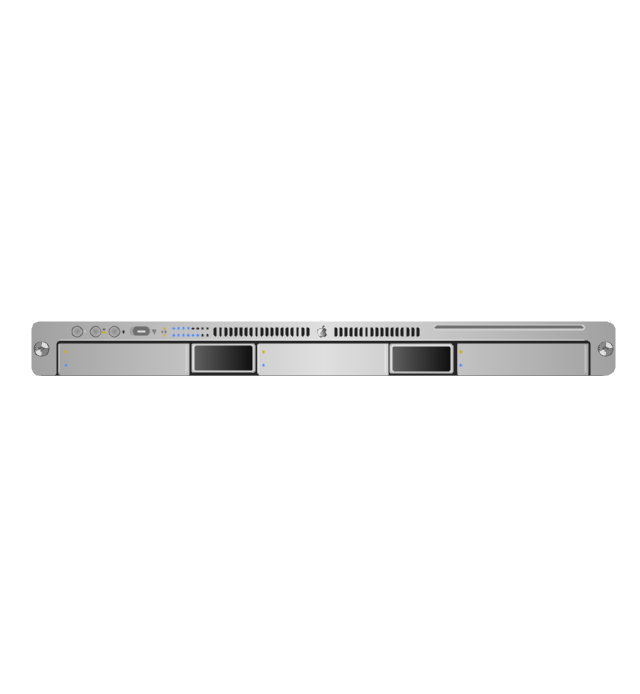
XServe
1U tray

1U spacer

2U server
1U Ethernet Switch/Hub
2U Ethernet Switch/Hub
1U power strip
1U KVM switch
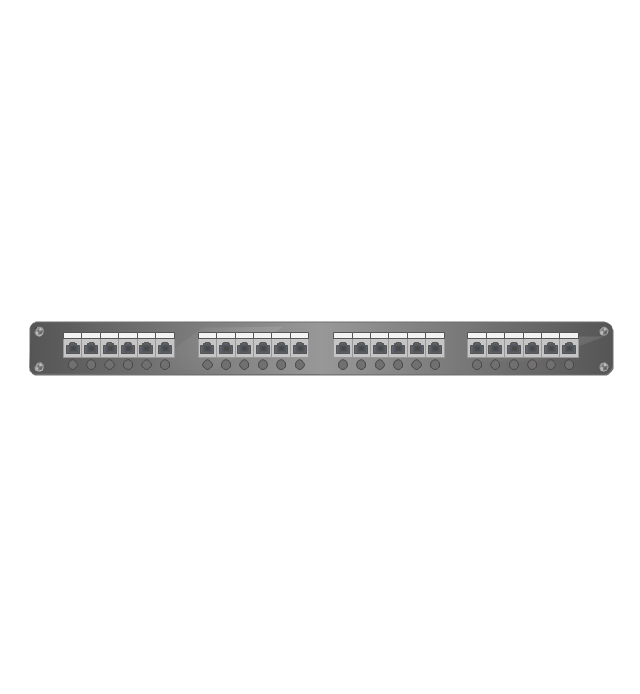
1U patch panel
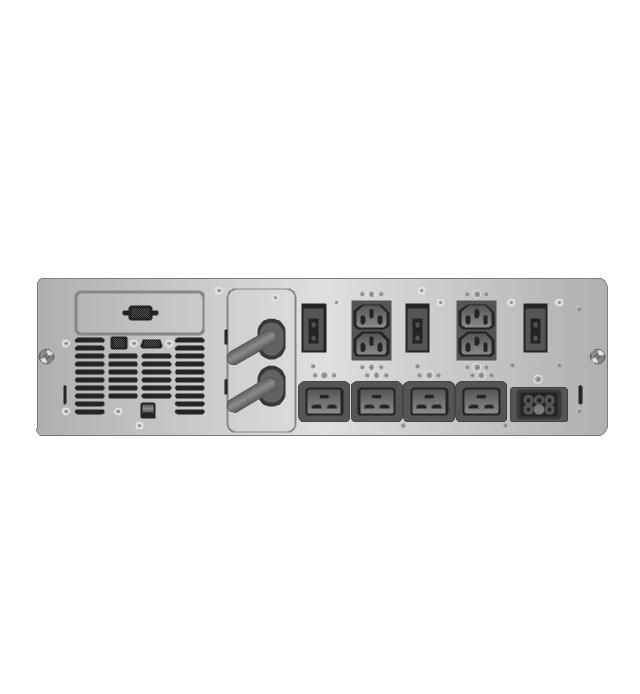
Rackmount UPS
Cisco switch (WS-C3560-24PS-S)
-rack-diagrams---vector-stencils-library.png--diagram-flowchart-example.png)
Cisco switch (WS-C3560-48TS-S)
-rack-diagrams---vector-stencils-library.png--diagram-flowchart-example.png)
Cisco switch (WS-C2960-48TT-L)
-rack-diagrams---vector-stencils-library.png--diagram-flowchart-example.png)
Cisco switch (WS-C2960-48TC-L)
-rack-diagrams---vector-stencils-library.png--diagram-flowchart-example.png)
Cisco switch (WS-C2960-24TT-L)
-rack-diagrams---vector-stencils-library.png--diagram-flowchart-example.png)
Cisco switch (WS-C2960-24TC-L)
-rack-diagrams---vector-stencils-library.png--diagram-flowchart-example.png)
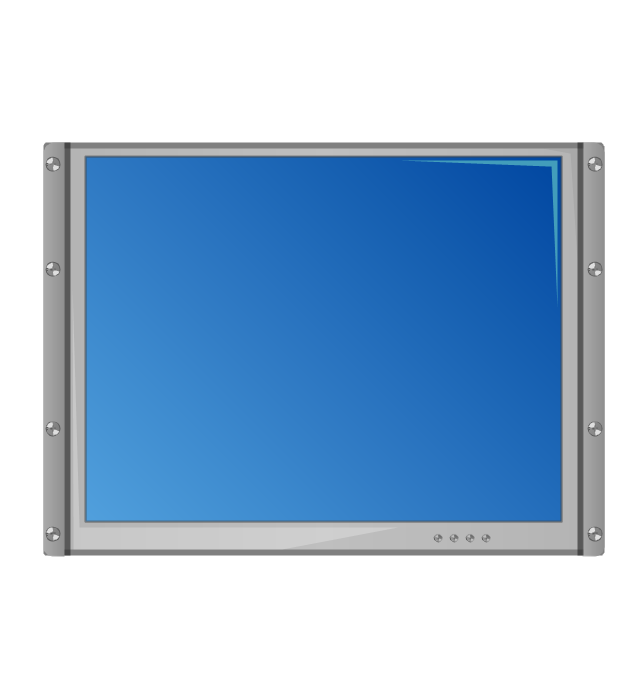
7U rackmount LCD monitor
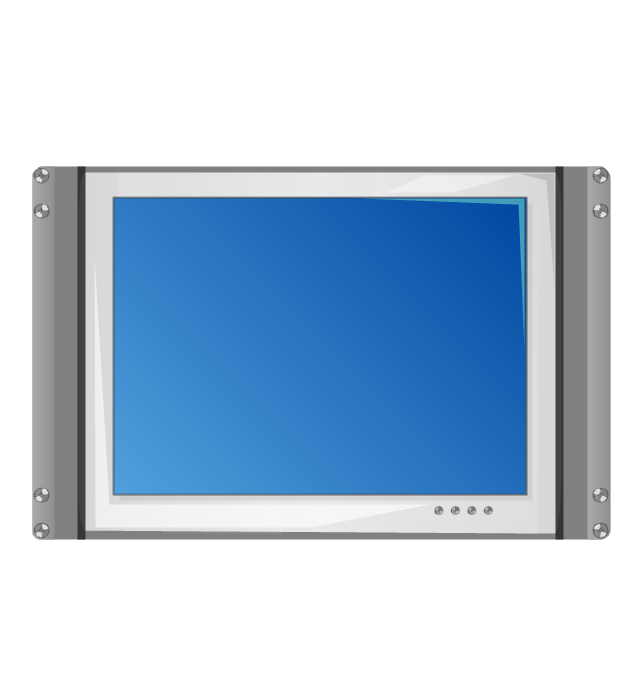
8U rackmount LCD monitor
Fiber optic patch panel (type A)
-rack-diagrams---vector-stencils-library.png--diagram-flowchart-example.png)
Fiber optic patch panel (type B)
-rack-diagrams---vector-stencils-library.png--diagram-flowchart-example.png)
Fiber optic patch panel (type C)
-rack-diagrams---vector-stencils-library.png--diagram-flowchart-example.png)
3U server
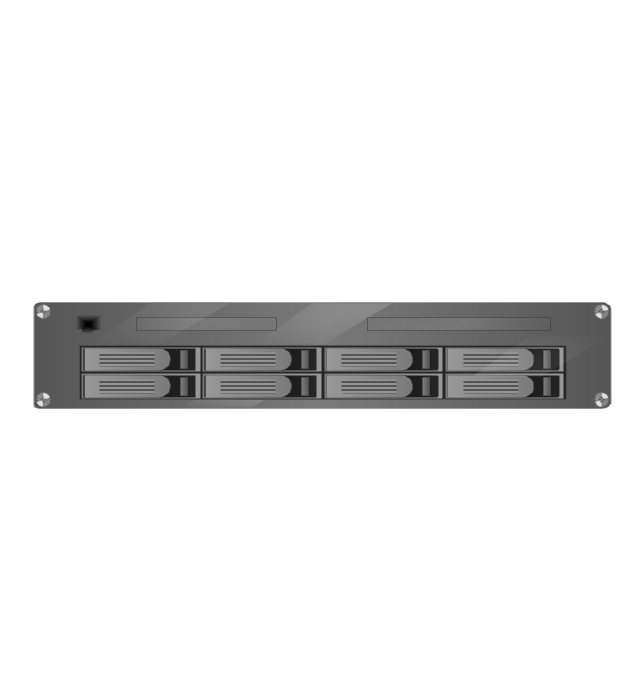
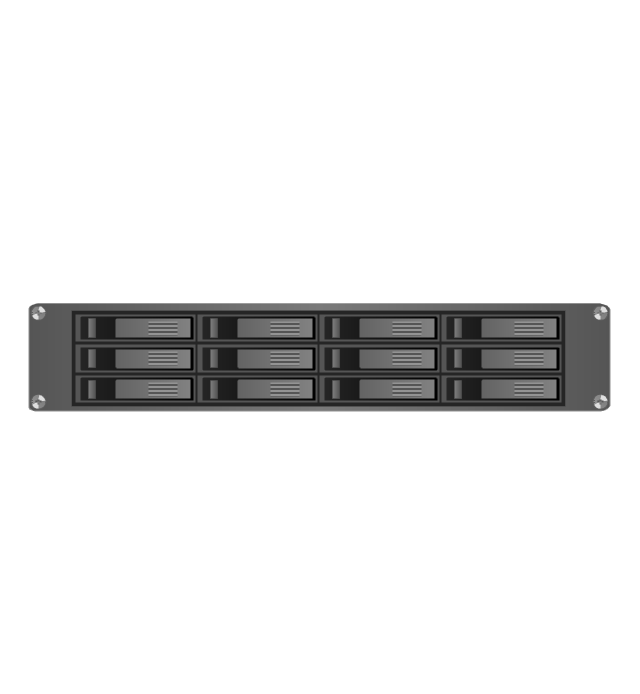
2U RAID array
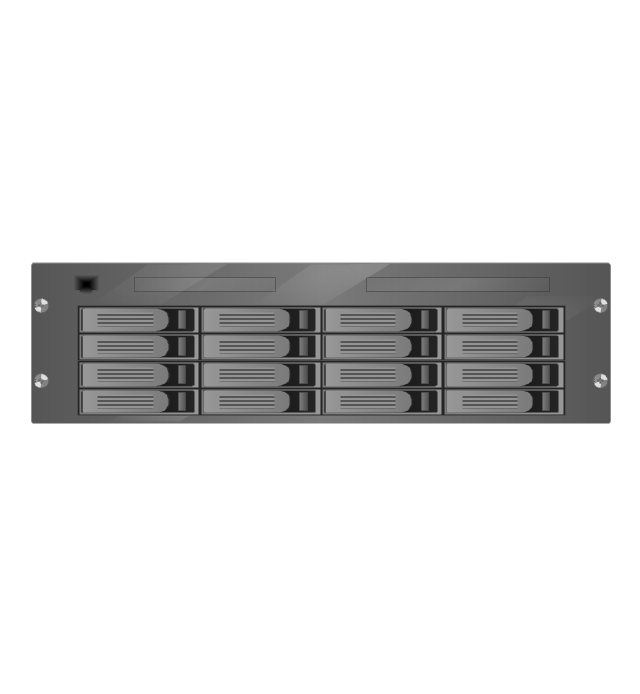
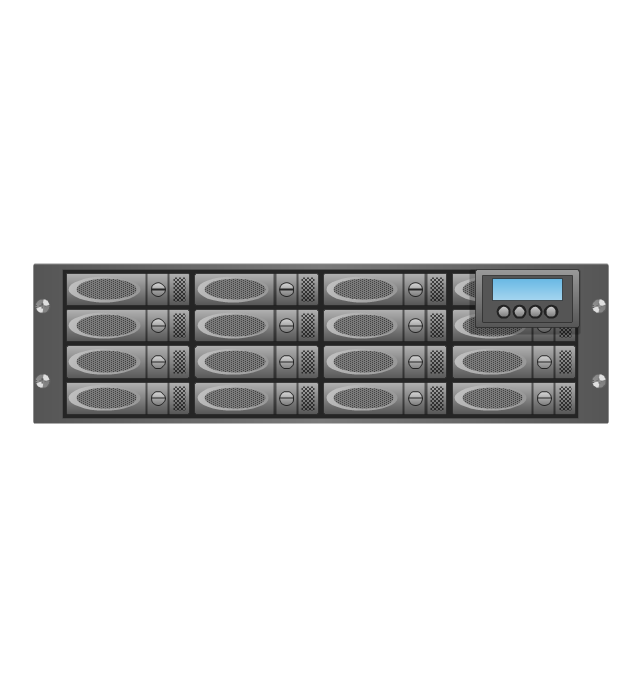
3U RAID array
Managed UPS
1U 19'' LCD monitor keyboard

1U server
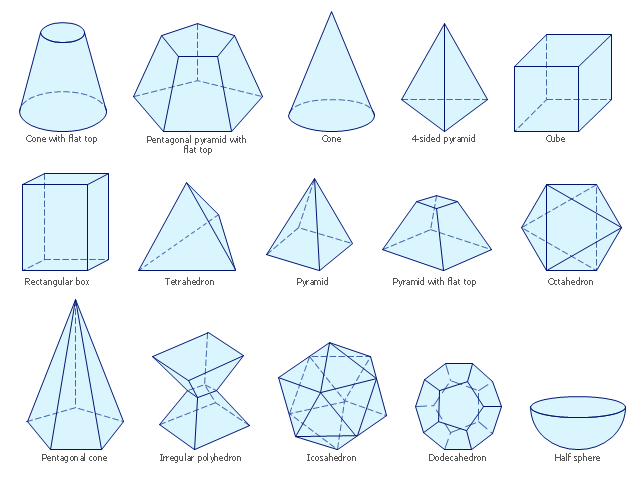
The vector stencils library "Solid geometry" contains 15 shapes of solid geometric figures.
"In mathematics, solid geometry was the traditional name for the geometry of three-dimensional Euclidean space - for practical purposes the kind of space we live in. It was developed following the development of plane geometry. Stereometry deals with the measurements of volumes of various solid figures including cylinder, circular cone, truncated cone, sphere, and prisms.
The Pythagoreans had dealt with the regular solids, but the pyramid, prism, cone and cylinder were not studied until the Platonists. Eudoxus established their measurement, proving the pyramid and cone to have one-third the volume of a prism and cylinder on the same base and of the same height, and was probably the discoverer of a proof that the volume of a sphere is proportional to the cube of its radius." [Solid geometry. Wikipedia]
The shapes example "Design elements - Solid geometry" was created using the ConceptDraw PRO diagramming and vector drawing software extended with the Mathematics solution from the Science and Education area of ConceptDraw Solution Park.
Solid geometrical figures
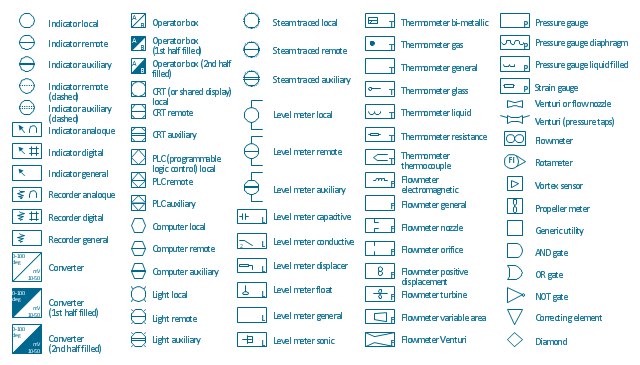
The vector stencils library "Instruments" contains 72 symbols of control instruments and measuring devices: meters and gauges, and callouts, text boxes, and inserts.
Use these shapes to create annotated process flow diagrams (PFD), flow control, manufacturing processes, and distribution system diagrams.
"Process control is an engineering discipline that deals with architectures, mechanisms and algorithms for maintaining the output of a specific process within a desired range.
Process control is extensively used in industry and enables mass production of continuous processes such as oil refining, paper manufacturing, chemicals, power plants and many other industries. Process control enables automation, with which a small staff of operating personnel can operate a complex process from a central control room." [Process control. Wikipedia]
The example "Design elements - Instruments" was created using the ConceptDraw PRO diagramming and vector drawing software extended with the Chemical and Process Engineering solution from the Engineering area of ConceptDraw Solution Park.
Process control instrument symbols
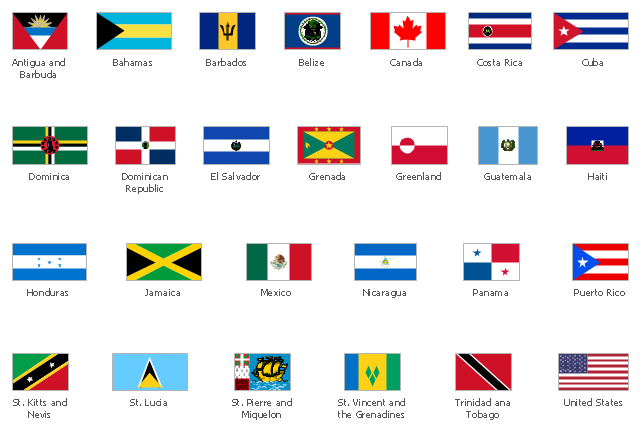
The vector stencils library "North and Central America country flags" contains 26 North and Central American state flags clipart.
Use this clip art library to illustrate your business documents, presentation slides, webpages, infographics.
The clip art example "Design elements - North and Central America country flags" was created using the ConceptDraw PRO diagramming and vector drawing software extended with the Artwork solution from the Illustration area of ConceptDraw Solution Park.
North and Central American state flags clip art
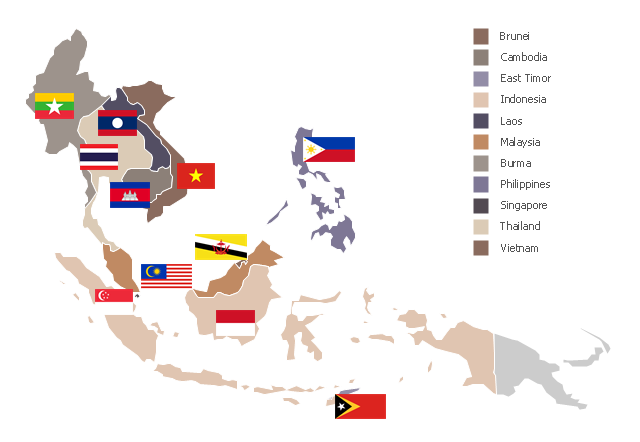
"Southeast Asia or Southeastern Asia is a subregion of Asia, consisting of the countries that are geographically south of China, east of India, west of New Guinea and north of Australia. The region lies near the intersection of geological plates, with heavy seismic and volcanic activity. Southeast Asia consists of two geographic regions:
(1) Maritime Southeast Asia, comprising Philippines, East Malaysia, East Timor, Indonesia, Brunei, and Singapore.
(2) Mainland Southeast Asia, also known as Indochina, comprising Cambodia, Laos, Myanmar (Burma), Thailand, West Malaysia and Vietnam." [Southeast Asia. Wikipedia]
This political map sample was redesigned from the Wikimedia Commons file: Suresteasia324.jpg. [commons.wikimedia.org/ wiki/ File:Suresteasia324.jpg]
This file is licensed under the Creative Commons Attribution-Share Alike 3.0 Unported license. [creativecommons.org/ licenses/ by-sa/ 3.0/ deed.en]
The example "Southeast Asia - Political map" was created using the ConceptDraw PRO diagramming and vector drawing software extended with the Continent Maps solution from the Maps area of ConceptDraw Solution Park.
Political map - Southeast Asia
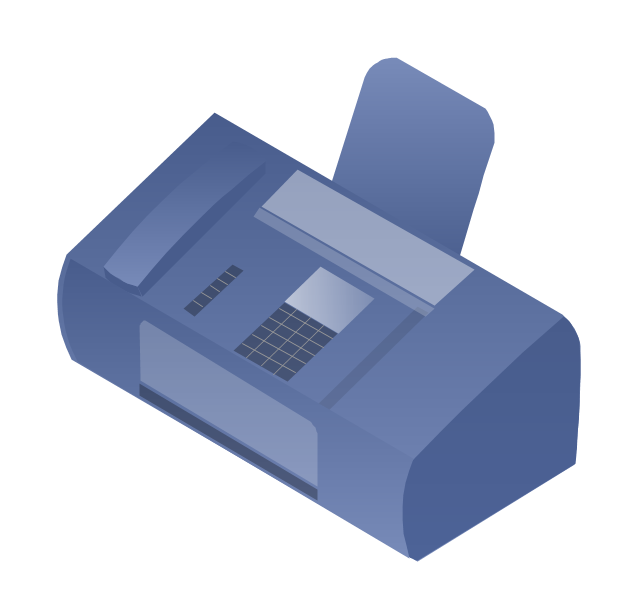
The vector stencils library "Telecommunication networks" contains 32 clipart images of telecommunication network devices and equipment for drawing telecom network diagrams.
"A telecommunications network is a collection of terminal nodes, links and any intermediate nodes which are connected so as to enable telecommunication between the terminals.
The transmission links connect the nodes together. The nodes use circuit switching, message switching or packet switching to pass the signal through the correct links and nodes to reach the correct destination terminal.
Each terminal in the network usually has a unique address so messages or connections can be routed to the correct recipients. The collection of addresses in the network is called the address space." [Telecommunications network. Wikipedia]
The clip art example "Telecommunication networks - Vector stencils library" was created using the ConceptDraw PRO diagramming and vector drawing software extended with the Telecommunication Network Diagrams solution from the Computer and Networks area of ConceptDraw Solution Park.
Internet

Globe

Base station

Satellite dish

Satellite dish

Communications satellite

Wireless cell tower

Radio waves

Radio waves

Cellular phone

Server

Laptop computer

Desktop computer

Car

Satellite truck

House

House

Office building

Mountain

Tree

Tree

User

Call-center

Multi-storey

Antenna

Router

IP phone

Fax
Network cell

IP Camera

Wireless router

Networking device

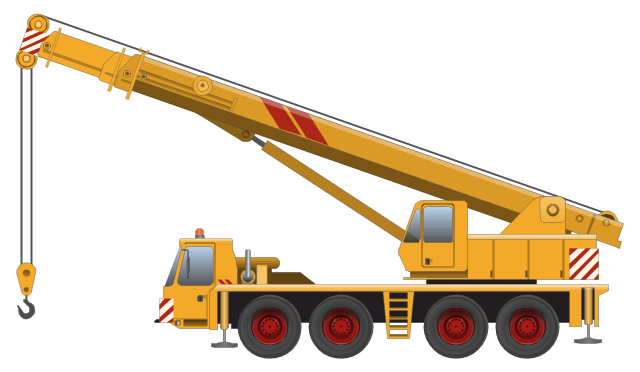
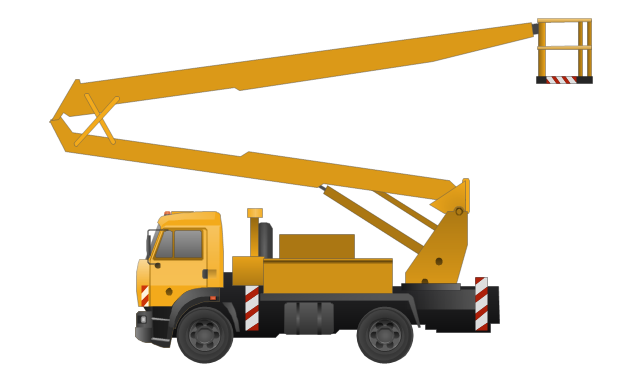
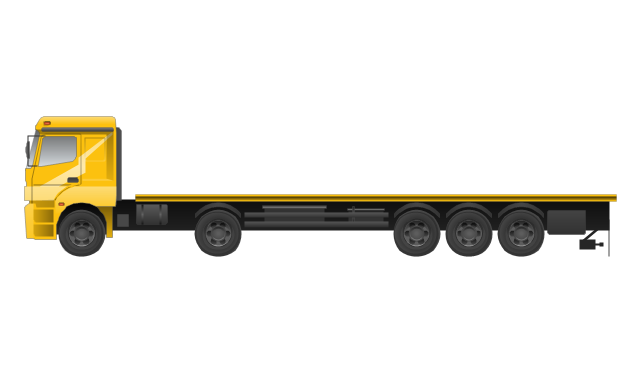
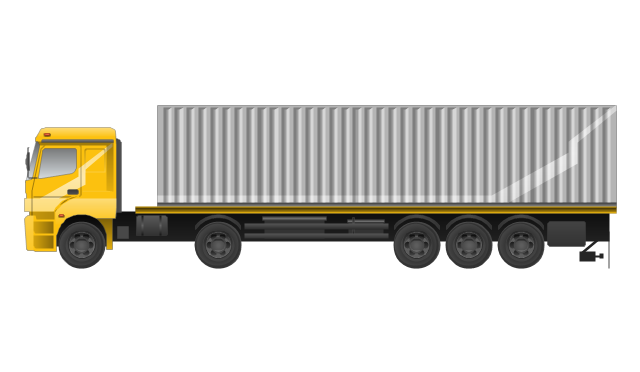
The vector stencils library "Industrial vehicles" contains 14 clipart images of industrial and building vehicles for drawing illustrations.
"A truck (US, CA, AU, NZ) or lorry (UK and Ireland) is a motor vehicle designed to transport cargo. Trucks vary greatly in size, power, and configuration, with the smallest being mechanically similar to an automobile. Commercial trucks can be very large and powerful, and may be configured to mount specialized equipment, such as in the case of fire trucks and concrete mixers and suction excavators. Modern trucks are largely powered by diesel engines exclusively, although small to medium size trucks with gasoline engines exist in America. In the European Union vehicles with a gross combination mass of less than 3,500 kilograms (7,716 lb) are known as light commercial vehicles and those over as large goods vehicles." [Truck. Wikipedia]
The clip art example "Industrial vehicles - Vector stencils library" was created in the ConceptDraw PRO diagramming and vector drawing software using the Manufacturing and Maintenance solution from the Illustration area of ConceptDraw Solution Park.
Excavator

Bucket loader

Forklift truck

Road roller

Dumper truck

Tank truck

Concrete mixing transport truck

Truck-mounted crane
Aerial work platform
Tractor

Tractor with a trailer

Tractor with a petrol tanker

Full trailer truck
Trailer with container
A four level pyramid model of different types of Information Systems based on the different levels of hierarchy in an organization. The first level represents transaction processing systems for workers. The second level represents management information systems for middle managers. The third level represents decision support systems for senior menegers. The fourth level represents executive information systems for executives.
"The "classic" view of Information systems found in the textbooks in the 1980s was of a pyramid of systems that reflected the hierarchy of the organization, usually transaction processing systems at the bottom of the pyramid, followed by management information systems, decision support systems, and ending with executive information systems at the top. Although the pyramid model remains useful, since it was first formulated a number of new technologies have been developed and new categories of information systems have emerged, some of which no longer fit easily into the original pyramid model.
Some examples of such systems are:
data warehouses,
enterprise resource planning,
enterprise systems,
expert systems,
search engines,
geographic information system,
global information system,
office automation." [Information systems. Wikipedia]
This diagram was redesigned using the ConceptDraw PRO diagramming and vector drawing software from Wikimedia Commons file Four-Level-Pyramid-model.png. [commons.wikimedia.org/ wiki/ File:Four-Level-Pyramid-model.png]
This file is licensed under the Creative Commons Attribution-Share Alike 3.0 Unported license. [creativecommons.org/ licenses/ by-sa/ 3.0/ deed.en]
The triangle chart example "Information systems types" is included in the Pyramid Diagrams solution from the Marketing area of ConceptDraw Solution Park.
Pyramid diagram

- Pictures of Graphs | Pictures of Vegetables | Pictures of Food | Pict ...
- Pict Tool Example
- Pict Template
- Hand Saw Pict Pict
- Pict Typography
- Reporting Finance Pict
- Hand Movements Pict
- Pict Coffee Png
- Pict Microsoft Apps
- Sports Pict
- ERD | Entity Relationship Diagrams, ERD Software for Mac and Win
- Flowchart | Basic Flowchart Symbols and Meaning
- Flowchart | Flowchart Design - Symbols, Shapes, Stencils and Icons
- Flowchart | Flow Chart Symbols
- Electrical | Electrical Drawing - Wiring and Circuits Schematics
- Flowchart | Common Flowchart Symbols
- Flowchart | Common Flowchart Symbols