Line Graph

Data Flow Diagram Example

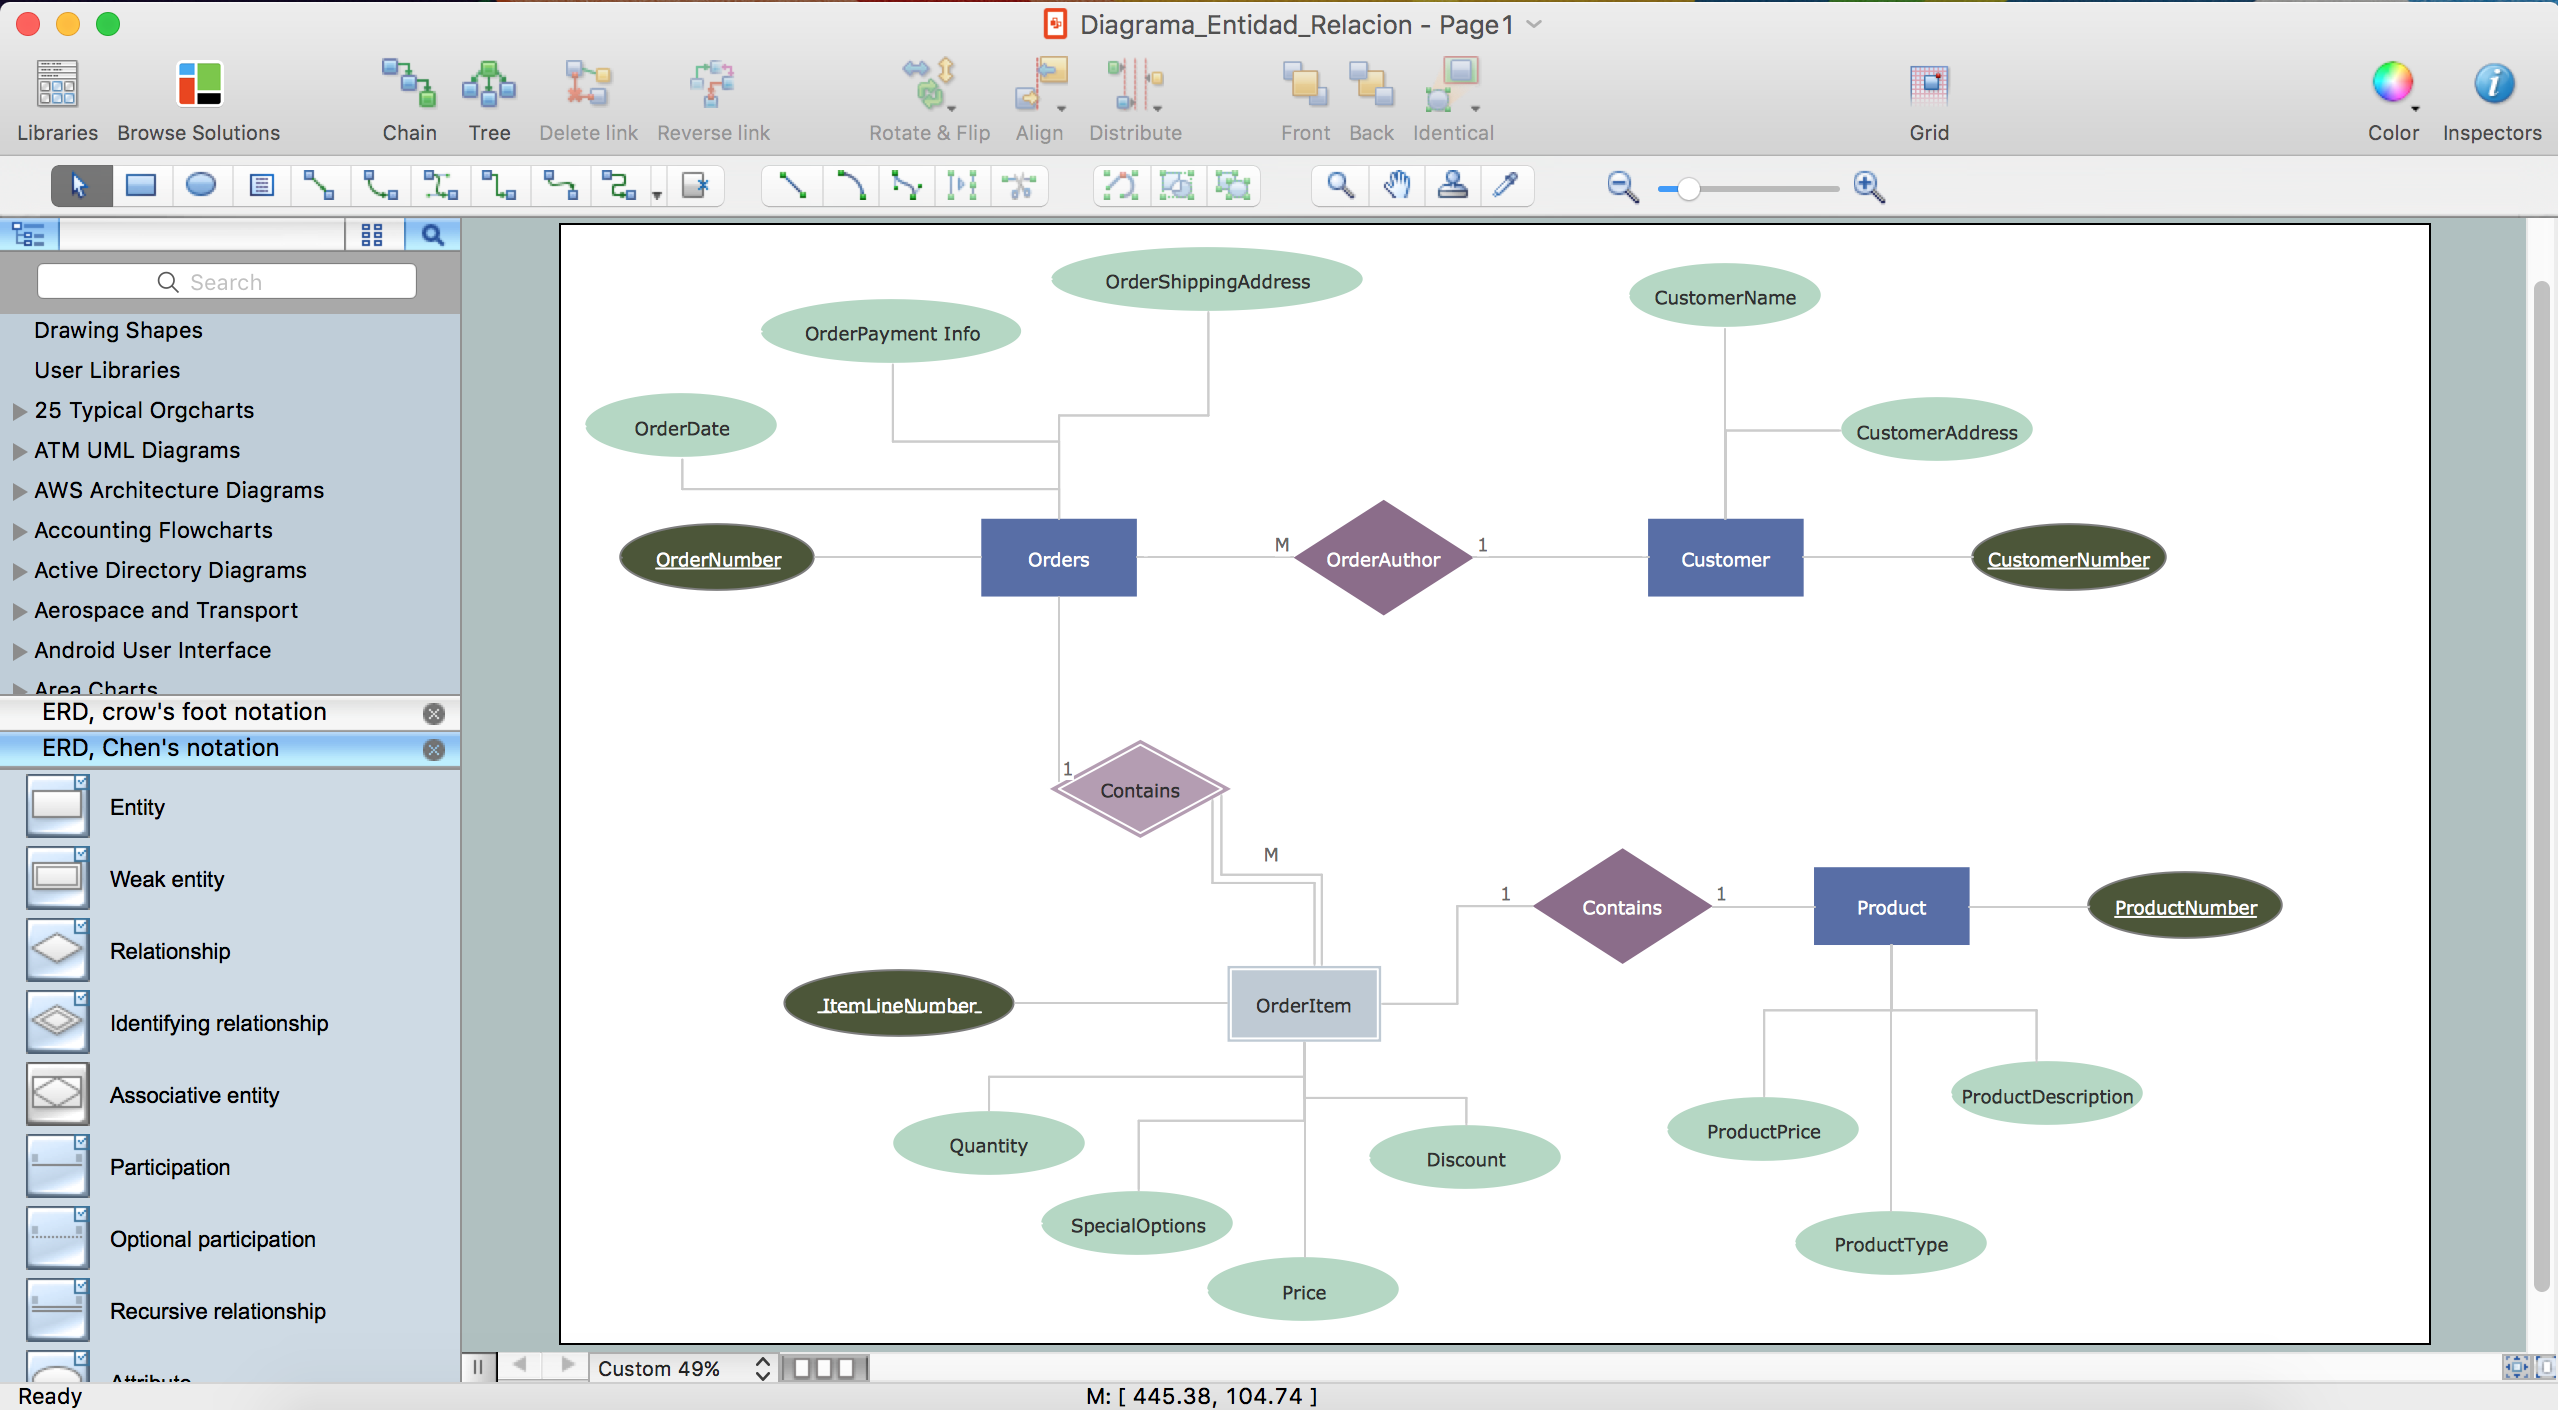
ER diagram tool for OS X
Cause and Effect Analysis - Fishbone Diagrams for Problem Solving

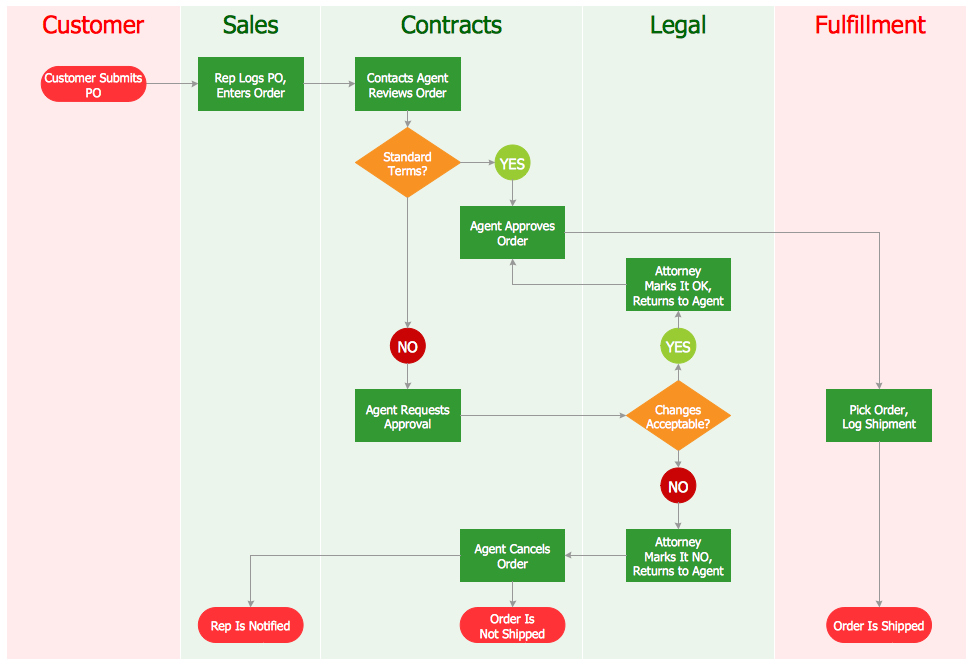
Swim Lane Flowchart Symbols

ConceptDraw DIAGRAM DFD Software

Process Flow Diagrams
Affinity Diagram

 Plant Layout Plans
Plant Layout Plans solution can be used for power plant design and plant layout design, for making the needed building plant plans and plant layouts looking professionally good. Having the newest plant layout software, the plant design solutions and in particular the ConceptDraw’s Plant Layout Plans solution, including the pre-made templates, examples of the plant layout plans, and the stencil libraries with the design elements, the architects, electricians, interior designers, builders, telecommunications managers, plant design engineers, and other technicians can use them to create the professionally looking drawings within only a few minutes.
Flowchart Definition

- Network Layout Floor Plans | Computer Network Diagrams | Network ...
- Physical And Logical Network Layout
- New Basic Floor Plans Solution for Complete Building Design
- Sample Of Computer Shop Floor Plan
- Computer Shop Layout Plan
- Workflow Of A Store In A Hotel
- Store Layout Software | Simple Diagramming | Basic Floor Plans ...
- Network Layout Floor Plans | Draw Network Diagram based on ...
- Store Layout Software | How To Create Restaurant Floor Plan in ...
- Basic Flowchart Symbols and Meaning | Data Flow Diagrams ...