Percentage Pie Chart. Pie Chart Examples

Chart Examples

Chart Templates

Process Flow Chart Examples

Flow Chart Diagram Examples

Pie Donut Chart. Pie Chart Examples

Flow Chart Drawing

How to Create a Process Flowchart

Basic Audit Flowchart. Flowchart Examples

How to Create a Pie Chart

Percentage Spider Chart

Column Chart Examples

How to Prepare Learning Presentations for Training

How to Realize your Social Media Strategy

 Pie Charts
Pie Charts are extensively used in statistics and business for explaining data and work results, in mass media for comparison (i.e. to visualize the percentage for the parts of one total), and in many other fields. The Pie Charts solution for ConceptDraw DIAGRAM offers powerful drawing tools, varied templates, samples, and a library of vector stencils for simple construction and design of Pie Charts, Donut Chart, and Pie Graph Worksheets.
Pie Chart Software

Easy Flowchart Software

UML Class Diagram Example - Buildings and Rooms

This pie chart sample shows the make up of the top one percent of United States wage earners, grouped by occupation. Data for this graph is sourced from the November 2010 report written by Jon Bakija, Adam Cole, and Bradley T. Heim titled "Jobs and Income Growth of Top Earners and the Causes of Changing Income Inequality: Evidence from U.S. Tax Return Data", column "2005" in table 2, titled "Percentage of primary taxpayers in top one percent of the distribution of income (excluding capital gains) that are in each occupation", on page 50.
This pie chart sample was redesigned from the Wikimedia Commons file: Percentage of the top 1% wage earners in the United States by occupation (pie chart).svg.
[commons.wikimedia.org/ wiki/ File:Percentage_ of_ the_ top_ 1%25_ wage_ earners_ in_ the_ United_ States_ by_ occupation_ (pie_ chart).svg]
This file is licensed under the Creative Commons Attribution-Share Alike 3.0 Unported license. [creativecommons.org/ licenses/ by-sa/ 3.0/ deed.en]
"The distribution of wealth is a comparison of the wealth of various members or groups in a society. It differs from the distribution of income in that it looks at the distribution of ownership of the assets in a society, rather than the current income of members of that society." [Distribution of wealth. Wikipedia]
The pie chart example "Percentage of the top 1% wage earners in the US by occupation" was created using the ConceptDraw PRO diagramming and vector drawing software extended with the Pie Charts solutiton of the Graphs and Charts area in ConceptDraw Solution Park.
Pie chart

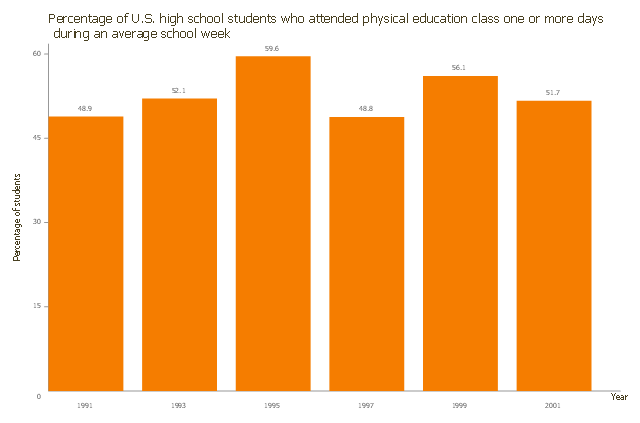
This vertical bar chart sample shows the percentage of U.S. high school students. It was designed on the base of the bar graph from the article "Childhood Obesity — What We Can Learn From Existing Data on Societal Trends, Part 2" on the U.S. Centers for Disease Control and Prevention (CDC) website.
[cdc.gov/ pcd/ issues/ 2005/ apr/ 04_ 0039.htm]
"Childhood obesity is a condition where excess body fat negatively affects a child's health or well-being. As methods to determine body fat directly are difficult, the diagnosis of obesity is often based on BMI. Due to the rising prevalence of obesity in children and its many adverse health effects it is being recognized as a serious public health concern." [Childhood obesity. Wikipedia]
The column chart example "Percentage of U.S. high school students" was created using the ConceptDraw PRO diagramming and vector drawing software extended with the Bar Graphs solution from the Graphs and Charts area of ConceptDraw Solution Park.
Column chart
- How To Create a Flow Chart in ConceptDraw | Chart Examples ...
- Process Flowchart | Percentage Pie Chart. Pie Chart Examples ...
- Sales Process Flowchart . Flowchart Examples | Process Flowchart ...
- Pie Charts | Flow Diagram Of Percentage Solution
- Pie Charts | Air Percentage Circle
- Rainfall Bar Chart | Flow chart Example. Warehouse Flowchart ...
- Flowchart Components | Percentage Pie Chart. Pie Chart Examples ...
- Cubetto Flowchart | Design elements - Tables | Percentage of the ...
- Land sales process flowchart | Percentage of EU farm land by ...
- Pie Donut Chart. Pie Chart Examples | Percentage Pie Chart. Pie ...