HelpDesk
How to Draw a Pareto Chart

Total Quality Management with ConceptDraw

Seven Basic Tools of Quality - Fishbone Diagram

Seven Basic Tools of Quality - Pareto Chart
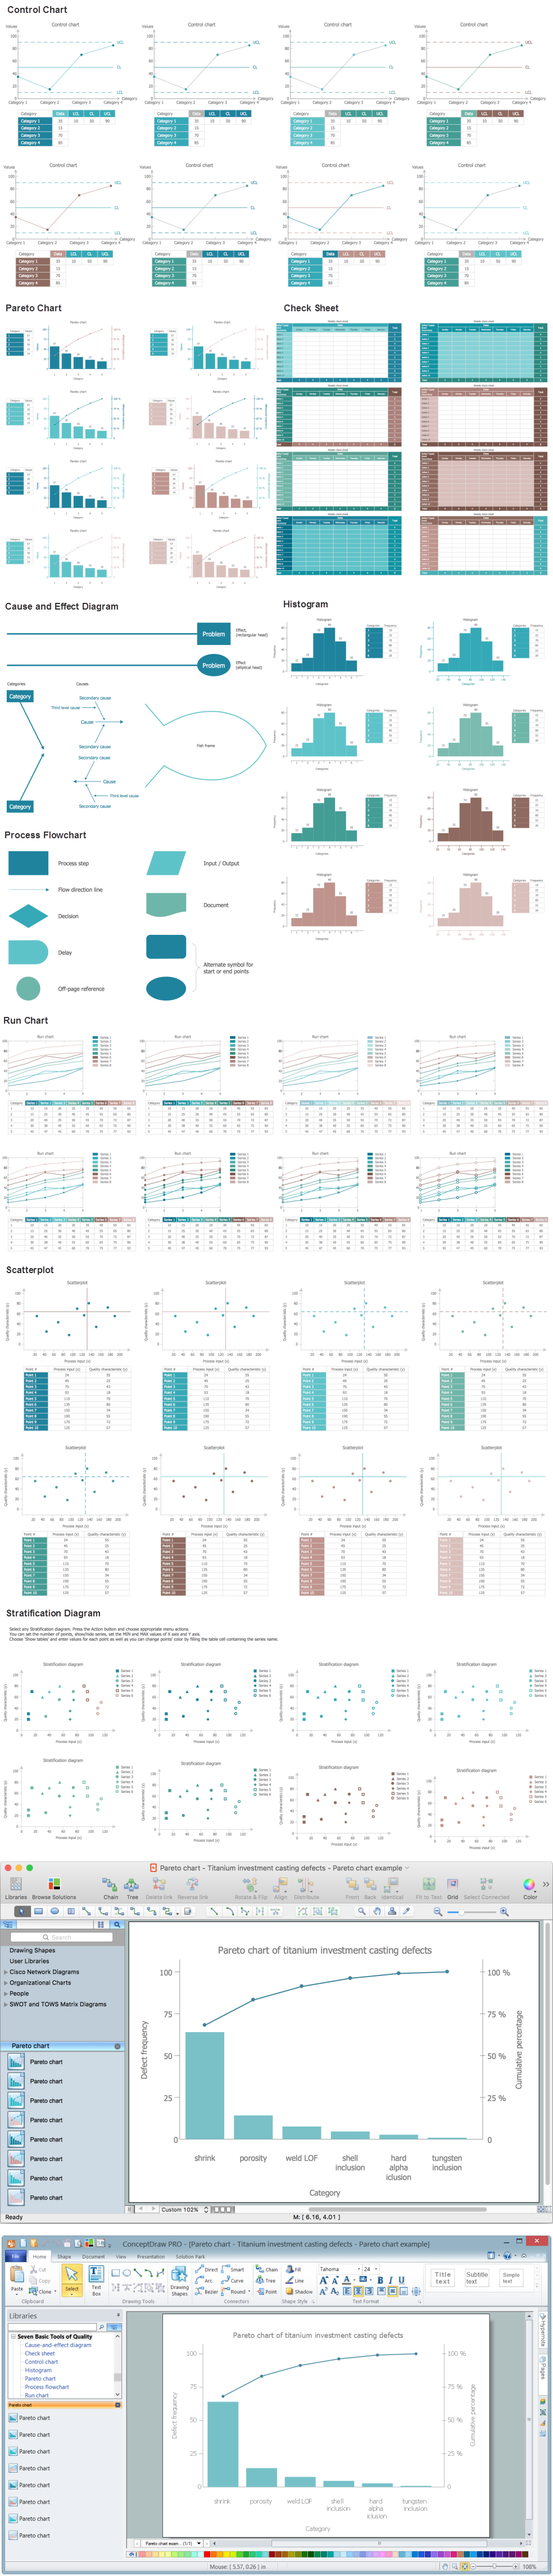
 Seven Basic Tools of Quality
Manage quality control in the workplace, using fishbone diagrams, flowcharts, Pareto charts and histograms, provided by the Seven Basic Tools of Quality solution.
Seven Basic Tools of Quality — Quality Control

Examples of Flowcharts, Org Charts and More


Seven Basic Tools of Quality - Histogram

 Business Package for Management
Package intended for professional who designing and documenting business processes, preparing business reports, plan projects and manage projects, manage organizational changes, prepare operational instructions, supervising specific department of an organization, workout customer service processes and prepare trainings for customer service personal, carry out a variety of duties to organize business workflow.
The vector stencils library "Process flowchart" contains 9 flow chart symbols.
Use it to design your process flowcharts with ConceptDraw PRO diagramming and vector drawing software.
"A flowchart is a type of diagram that represents an algorithm, workflow or process, showing the steps as boxes of various kinds, and their order by connecting them with arrows. ...
Kaoru Ishikawa defined the flowchart as one of the seven basic tools of quality control, next to the histogram, Pareto chart, check sheet, control chart, cause-and-effect diagram, and the scatter diagram. ...
Common alternative names include: flowchart, process flowchart, functional flowchart, process map, process chart, functional process chart, business process model, process model, process flow diagram, work flow diagram, business flow diagram. The terms "flowchart" and "flow chart" are used interchangeably." [Flowchart. Wikipedia]
The example of flow chart symbols "Design elements - Process flowchart" is included in the Seven Basic Tools of Quality solution from the Quality area of ConceptDraw Solution Park.
Process flowchart symbols

- How to Draw a Pareto Chart Using ConceptDraw PRO | Pareto ...
- Process Flowchart | How to Draw a Pareto Chart Using ...
- 7 Qc Tools Pareto Diagram Images
- How to Draw a Pareto Chart Using ConceptDraw PRO | Process ...
- TQM Diagram Tool | Probability Quality Control Tools | Total Quality ...
- Scatter Diagrams | How to Draw a Scatter Diagram Using ...
- Football – 2014 FIFA World Cup Standings Group | How to Draw a ...
- Quality Drawing Chart
- Draw Quality Control Tool On Computer
- Chart Of All Drawing Sign Of Quality
- Simple Diagramming | How to Draw a Scatter Diagram Using ...
- Seven Basic Tools of Quality - Fishbone Diagram | Seven Basic ...
- Fishbone Diagrams | How to Draw a Fishbone Diagram with ...
- Electrical Symbols, Electrical Diagram Symbols | Event-driven ...
- How to Create a Mechanical Diagram | Mechanical Drawing ...
- Seven Basic Tools of Quality | Electrical Drawing Software and ...
- 7 Tools For Quality Example
- Draw Fishbone Diagram on MAC Software | Fishbone Diagram ...
- How to Draw a Pyramid Diagram in ConceptDraw PRO | How to ...
- Process Flowchart | How to Draw a Chemical Process Flow Diagram ...