This site uses cookies. By continuing to browse the ConceptDraw site you are agreeing to our Use of Site Cookies.

Work Order Process Flowchart. Business Process Mapping Examples

Create your own cross-functional flow charts of order processing steps using variety of vector objects from the libraries of Business Process Mapping Solution for ConceptDraw DIAGRAM Business Mapping Software and also collection of Business Process Maps, Flowcharts, Swim Lanes Diagrams and SIPOC Diagrams, and template from ConceptDraw STORE to create your own professional looking diagrams
The cross-functional flow chart example shows business process mapping of the real property work order.
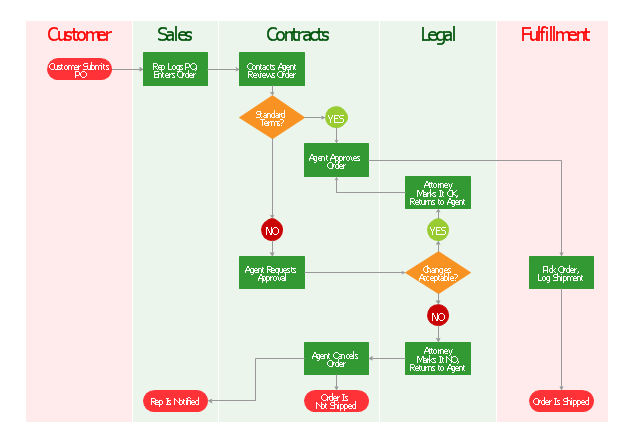
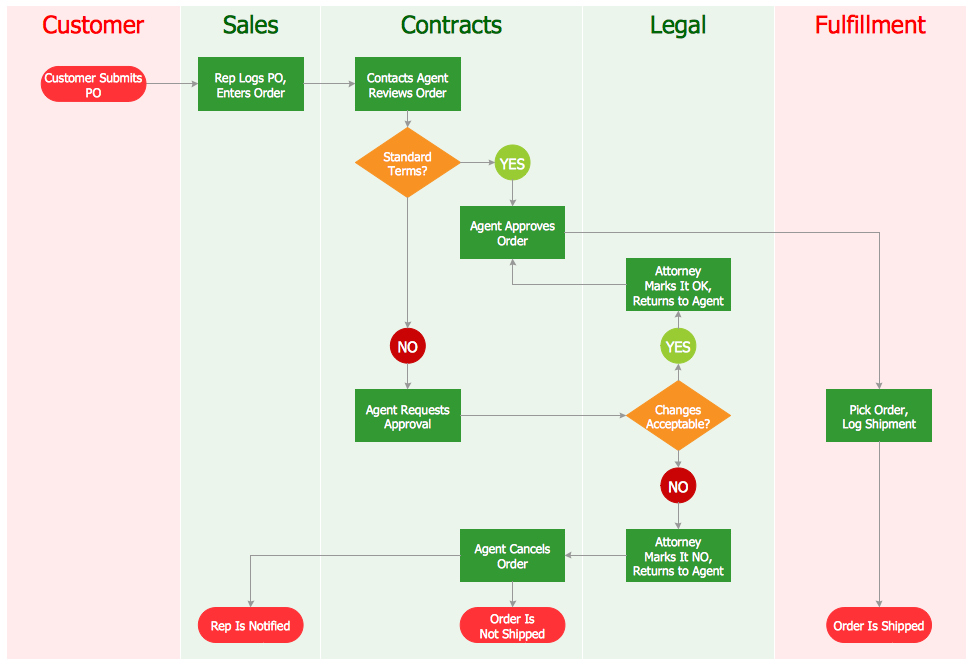
"Order processing is a key element of Order fulfillment. Order processing operations or facilities are commonly called "distribution centers". "Order processing" is the term generally used to describe the process or the work flow associated with the picking, packing and delivery of the packed item(s) to a shipping carrier. The specific "order fulfillment process" or the operational procedures of distribution centers are determined by many factors. Each distribution center has its own unique requirements or priorities." [Order processing. Wikipedia]
The vertical cross-functional flow chart example "Order processing" was created using the ConceptDraw PRO diagramming and vector drawing software extended with the Flowcharts solution from the area "What is a Diagram" of ConceptDraw Solution Park.
Cross-functional flowchart
Cross-functional flowchart, terminator, swimlanes, cross-functional, process, decision,
Used Solutions

How to Create a Cross Functional Flow Chart

If neither of 45 vector shapes of the Cross-Functional Flowcharts solution don't fit your needs, you will want to learn How to create a unique Cross-Functional flowchart.

ConceptDraw Arrows10 Technology - This is more than enough versatility to draw any type of diagram with any degree of complexity.

Drawing software lets you to make horizontal and vertical, audit, opportunity and many more flowcharts.

Check Order Process Flowchart. Flowchart Examples

This sample was created in ConceptDraw DIAGRAM diagramming and vector drawing software using the Flowcharts solution from the Diagrams area of ConceptDraw Solution Park.
This sample shows the Flowchart of the printing the elements of the binary search tree. They are printed in the order from lowest to greatest. On this diagram you can see the rectangles that represent the steps and decision points that are represented as diamonds with questions. It is necessary to make the decision that will determine the next step.

Ordering Process Flowchart. Flowchart Examples

A flowchart is a widely used type of diagram that visually represents an algorithm, workflow or process, using the boxes of various kinds to depict the steps and connecting them with arrows to show the order of execution these steps. Еhe ConceptDraw DIAGRAM supplied with Accounting Flowcharts Solution from the Finance and Accounting Area of ConceptDraw Solution Park is a powerful diagramming and vector drawing software which ideally suits for designing Ordering Process Flowchart of any complexity.

Processing Flow Chart

Processing Flow Chart is a simplified sketch which is used in chemical and process engineering for illustrating general plant streams, major equipments and key control loops.

ConceptDraw DIAGRAM enhanced with Flowcharts Solution from the "Diagrams" Area of ConceptDraw Solution Park is a powerful Processing Flow Chart software which will help save lots of your time.

Accounting Flowchart Symbols

If you deal everyday with accounting procedures, you might come to that point when you have to draw an accounting flowchart mentioning all the necessary details for getting the right result and in order to succeed in your field of business activity. Making it is truly simple in case you have ConceptDraw DIAGRAM which is a unique software that allows you to create any kinds of charts and flowcharts as well as schemes, diagrams and plans. This product is so special that once you start using it, you will understand the way it works quick and will never need any other software for the purpose of creating all mentioned above to see as a result incredible, smart, professional, sophisticated flowchart.

Process Flow Diagrams

A process flow diagram (PFD) is a diagram commonly used in chemical and process engineering to indicate the general flow of plant processes and equipment.
ConceptDraw DIAGRAM diagramming and vector drawing software extended with Flowcharts Solution from the "Diagrams" Area of ConceptDraw Solution Park offers the extensive drawing tools for quick and easy design professional looking Process Flow Diagrams.

Flowchart Definition

Flowchart definition - A Flowchart is a graphically representation of the structure of process or system, algorithm or the step-by-step solution of the problem. The Flowchart describes the flow of data through an information processing systems and the parts of the flows. The flow is a set of the logic operations that meet the certain requirements.

What is a Cross Functional Flow Chart?

For those who want to know what is a cross functional flowchart and how to draw it, we preared a special library and professional looking templates.

Take all the advantage of your drawing software to learn and create such a well-designed flowcharts.

Watch the HowTo video to learn more.