The vector stencils library "Winter Olympics pictograms" contains 29 pictograms and silhouettes.
Use it for drawing Winter Olympics diagrams, infographics and illustrations in the ConceptDraw PRO diagramming and vector drawing software extended with the Winter Sports solution from the Sport area of ConceptDraw Solution Park.
Use it for drawing Winter Olympics diagrams, infographics and illustrations in the ConceptDraw PRO diagramming and vector drawing software extended with the Winter Sports solution from the Sport area of ConceptDraw Solution Park.
Olympic rings
Olympic torch

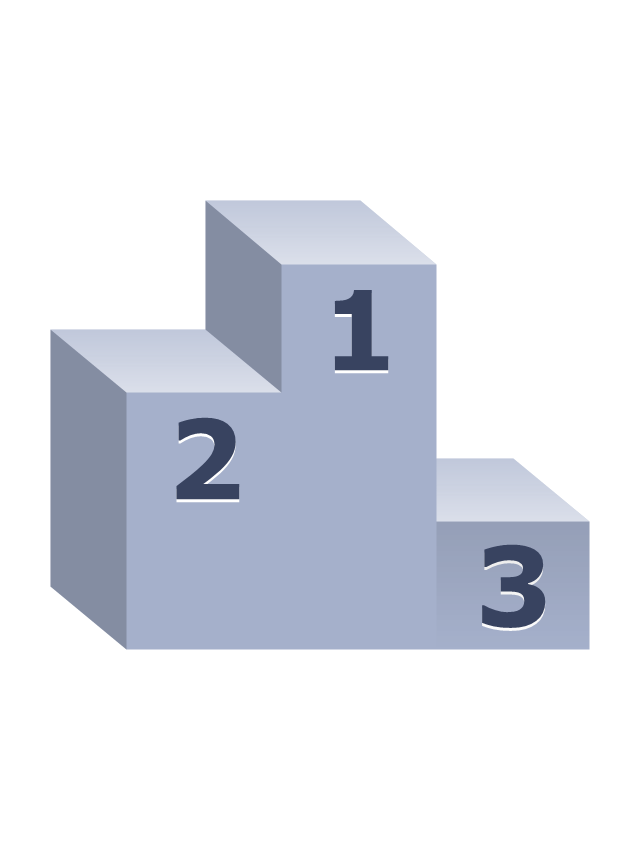
Olympic medal pedestal
Olympic medal, gold

Olympic medal, silver

Olympic medal, bronze

Olympic medal with ribbon, gold

Olympic medal with ribbon, silver

Olympic medal with ribbon, bronze

Skis
Ski poles

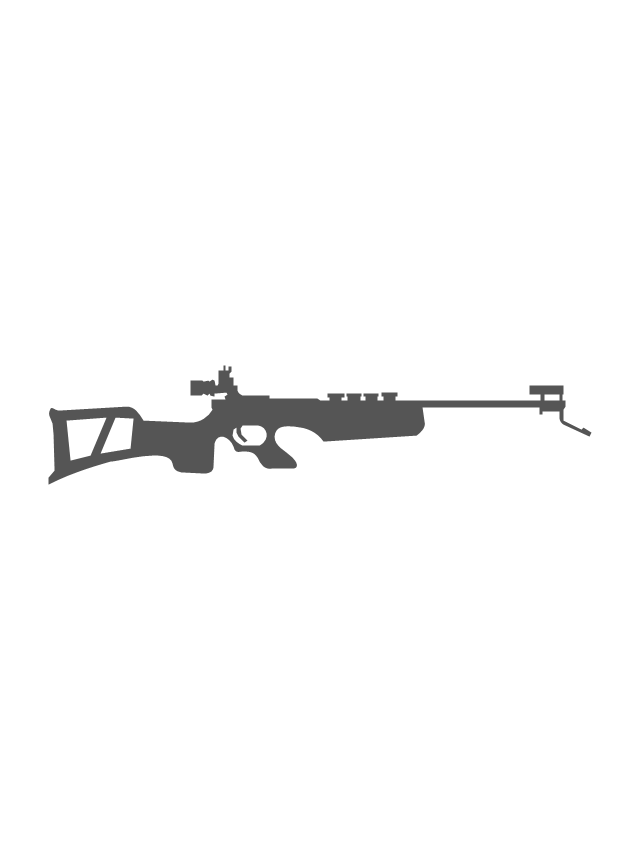
Biathlon rifle
Snowboard

Ski goggles

Ski gloves

Ice hockey helmet

Hockey stick

Hockey puck
Ice hockey skates

Ice skates

Luge

Bobsleigh sled

Curling stone

Curling broom

Mountains

Mountains 2

Snowflake

Fir-tree

Ski lift
Winter Sports Vector Clipart. Medal Map. Spatial Infographics

Winter Sports. Using Winter Sports Design Elements Producing Infographics

 Winter Sports
The Winter Sports solution from Sport area of ConceptDraw Solution Park contains winter sports illustration examples, templates and vector clipart libraries.
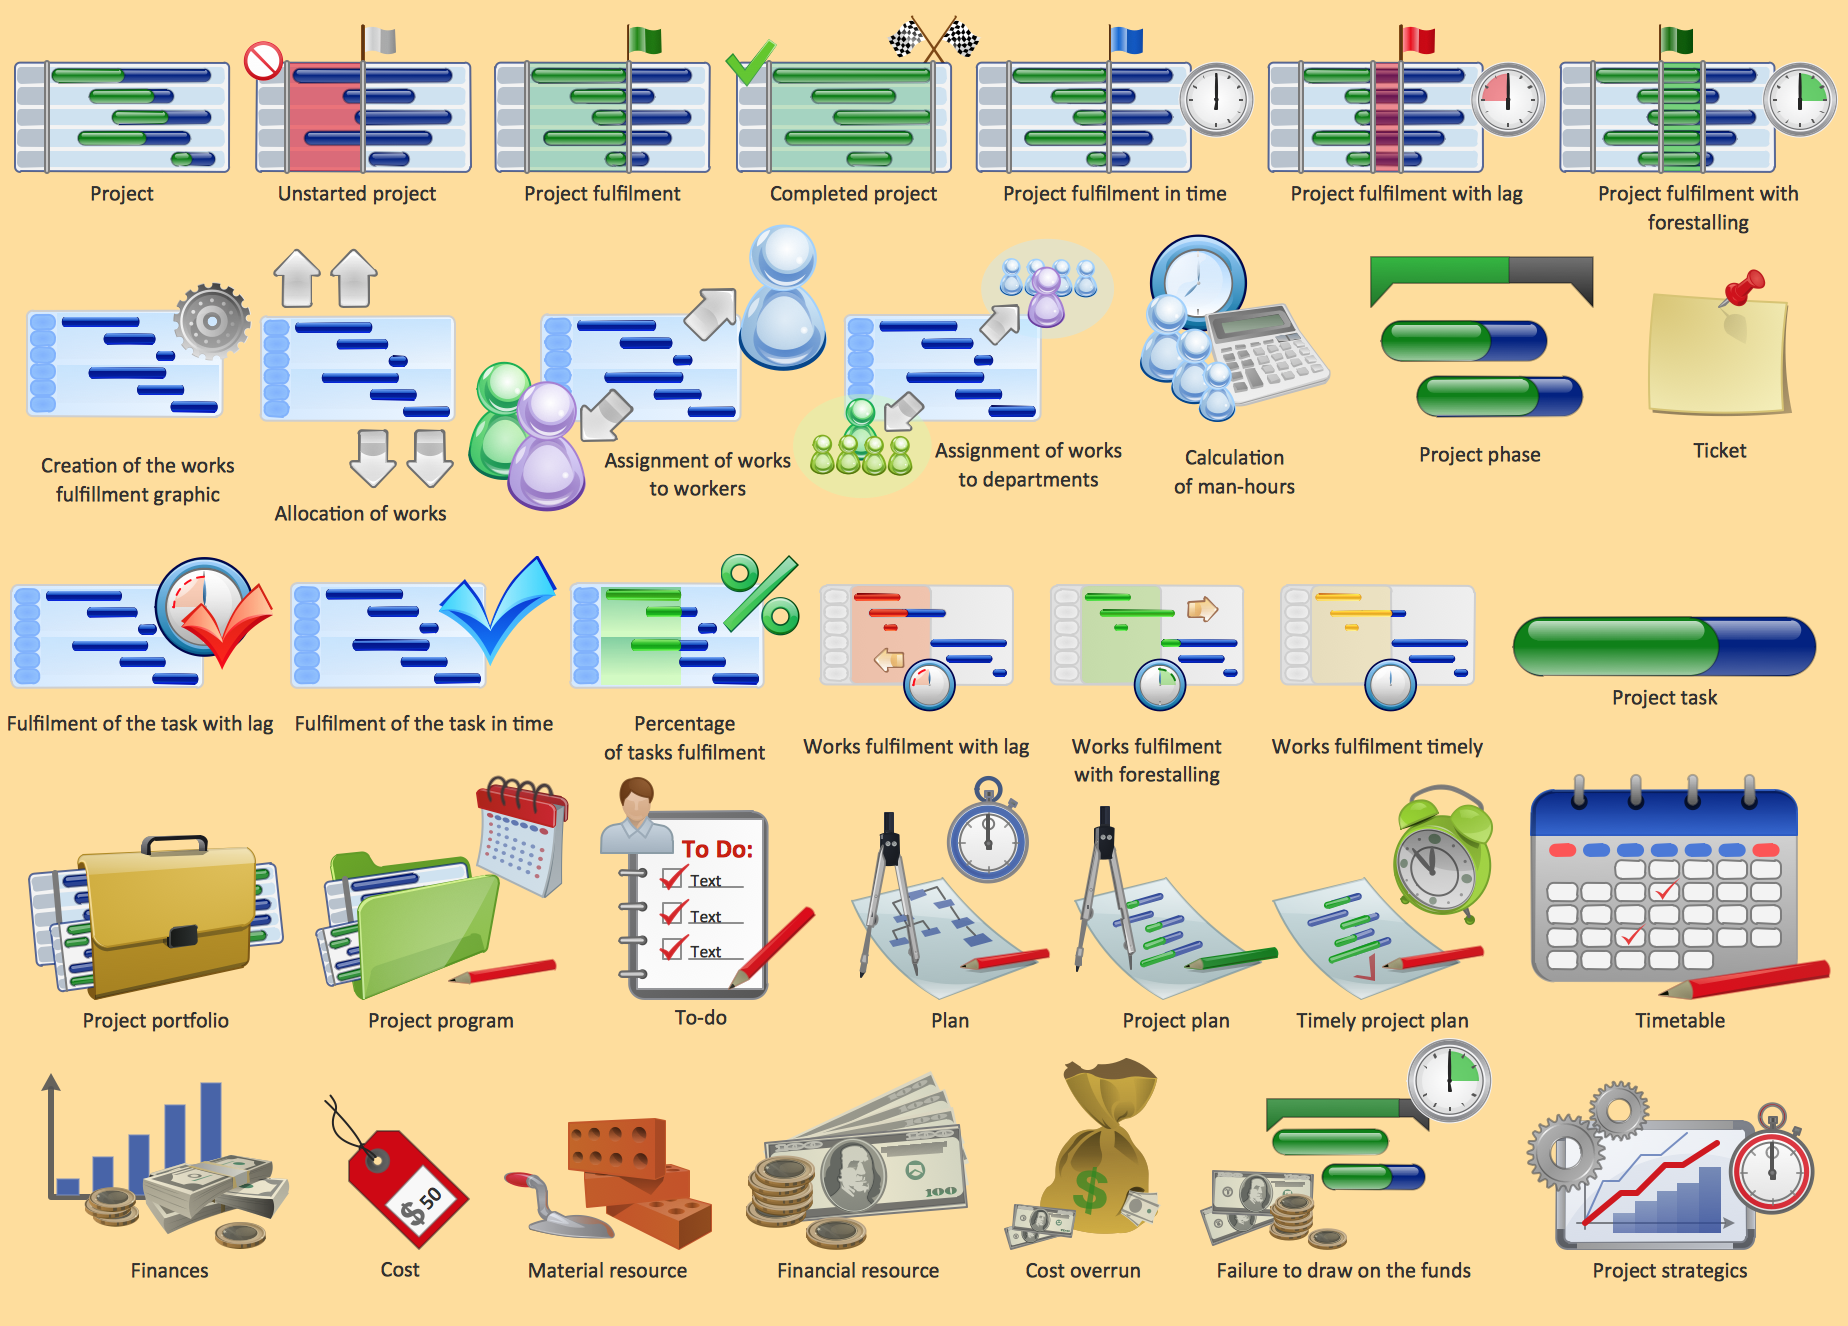
Project management - Design Elements
Mind Map Making Software

Flowchart Example: Flow Chart of Marketing Analysis

CORRECTIVE ACTIONS PLANNING. Involvement Matrix


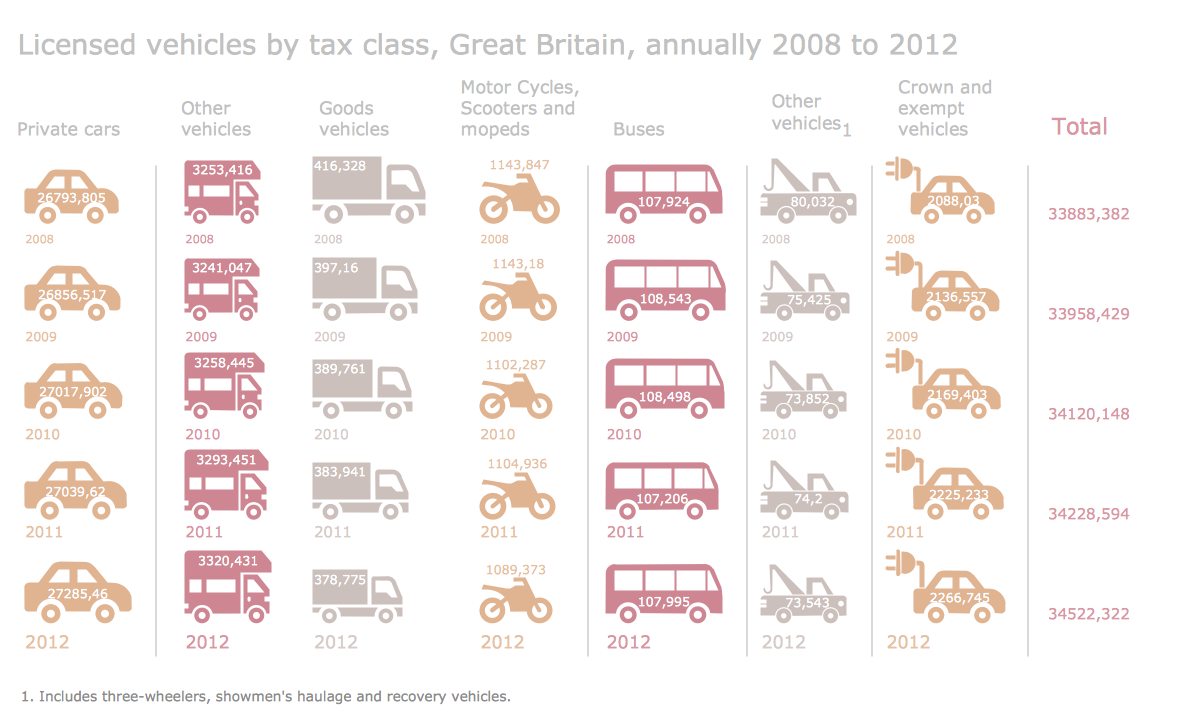
Design Pictorial Infographics. Design Infographics

Design Data Flow. DFD Library

 Area Charts
Area Charts are used to display the cumulative totals over time using numbers or percentages; or to show trends over time among related attributes. The Area Chart is effective when comparing two or more quantities. Each series of data is typically represented with a different color, the use of color transparency in an object’s transparency shows overlapped areas and smaller areas hidden behind larger areas.
Information Graphics
- Winter Sports. Olympic Games Illustrations. Medal Summary | App ...
- Winter Olympic Icons Ice Skating
- Energy-efficient game console | Winter Sports. Olympic Games ...
- Sport pictograms. Olympic Games | Design elements - Winter ...
- Silhouette Sport Icon Png
- Winter Sports. Olympic Games Illustrations. Medal Summary | Winter ...
- Flow Chart for Olympic Sports | Winter Sports Vector Clipart. Medal ...
- Winter Sports | Winter Sports. Olympic Games Illustrations. Medal ...
- Winter Olympics pictograms - Vector stencils library | Winter ...
- Sport pictograms. Olympic Games | Winter Sports. Using Winter ...
- Winter Olympics pictograms - Vector stencils library | Luge - Winter ...
- Luge - Winter sports pictograms | Winter Olympics pictograms ...
- Winter Sports. Olympic Games Illustrations. Medal Summary | Winter ...
- Winter Sports. Olympic Games Illustrations. Medal Summary | Winter ...
- Winter Olympics - Figure skating | Speed skating - Winter sports ...
- Skeleton - Winter sports pictograms | Sochi 2014 Olympics - Men's ...
- Alpine skiing - Winter sports pictograms | Winter Olympics ...
- Winter Olympics pictograms - Vector stencils library | Winter ...
- Winter Olympics pictograms - Vector stencils library | Design ...
- Winter Sports. Olympic Games Infographics. Medal Table | Winter ...