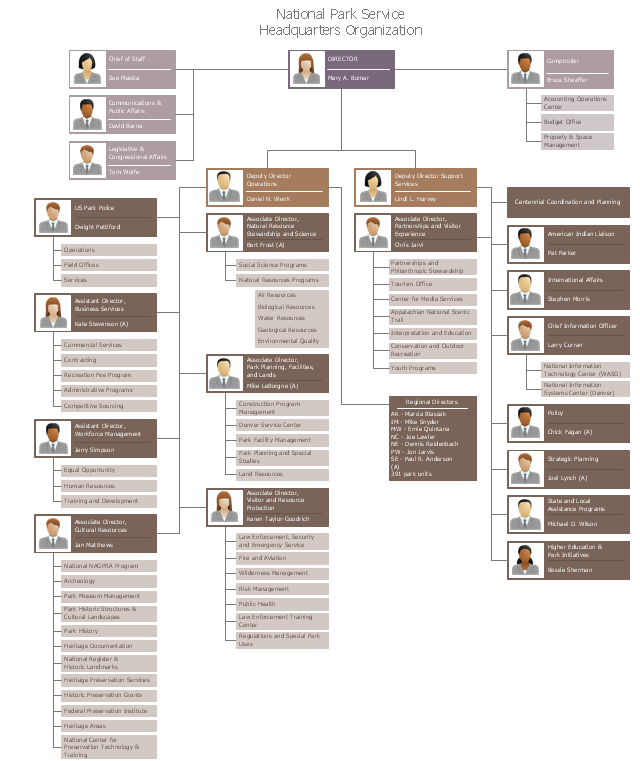
This organization chart of the National Park Service was redesigned from the Wikimedia Commons file: WASO Org Chart.JPG. [commons.wikimedia.org/ wiki/ File:WASO_ Org_ Chart.JPG]
"The National Park Service in the United States is a Bureau of the Department of the Interior with its headquarters located in Washington, D.C. The bureau consist of numerous support offices and seven regional offices, which oversee park operations within their geographic area." [Organization of the National Park Service. Wikipedia]
The org chart sample "National Park Service" was created using the ConceptDraw PRO diagramming and vector drawing software extended with the 25 Typical Organizational Charts solution from the Management area of ConceptDraw Solution Park.
Organizational Charts
Organizational Charts solution extends ConceptDraw DIAGRAM software with samples, templates and library of vector stencils for drawing the org charts.
Telecommunication Network Diagrams
Telecommunication Network Diagrams solution extends ConceptDraw DIAGRAM software with samples, templates, and great collection of vector stencils to help the specialists in a field of networks and telecommunications, as well as other users to create Computer systems networking and Telecommunication network diagrams for various fields, to organize the work of call centers, to design the GPRS networks and GPS navigational systems, mobile, satellite and hybrid communication networks, to construct the mobile TV networks and wireless broadband networks.
Organization Chart
ConceptDraw DIAGRAM diagramming and vector drawing software extended with 25 Typical Orgcharts solution from the Management area of ConceptDraw Solution Park offers 25 ready Organization Chart templates, 10 samples and 2 libraries with predesigned vector objects.How To Draw a Diagram
Is it possible to draw a diagram as quickly as the ideas come to you? The innovative ConceptDraw Arrows10 Technology included in ConceptDraw DIAGRAM is a simple and powerful tool to create any type of diagram. You mau choose to start from one of plenty diagram templates or to use your own idea.ConceptDraw DIAGRAM - Organizational chart software
Organizational Chart is a scheme which visualizes the composition of departments, sectors and other functional units of an organization, and also fixed relationships that exist between divisions and employees. ConceptDraw DIAGRAM enhanced with Organizational Charts solution is a powerful and cost effective Organizational chart software, which allows to automate the process of creation the high standard organizational charts, flow charts, time lines, and much more diagrams. It can be applied for analyzing organizational structure and drawing single or multi-page Organizational Charts with hyperlinks for the companies of any type, size and direction. Visualize the structure using the orgchartal tools, create easily as never before the Company Organizational Chart, Corporate Organizational Chart, Hospital Organizational Chart, University Organizational Chart, Hotel Organizational Chart, and then export, send by e-mail or publish it on Web in minutes, to communicate and discuss with colleagues or any other interested people.SWOT Analysis
The success of the company depends on how successfully it is able to react on different outside influences. When analyzing the external situation, it is necessary to identify the factors most significant on a specified period of time. An interrelated consideration of these factors with the company's possibilities allows to solve effectively appearing problems. One of the most common methods of assessment together internal and external factors influencing the company's development is a SWOT analysis. SWOT analysis (acronym composed of the first letters of the words: strength, weakness, opportunities, threats) is one of the most common and effective types of analysis in marketing and marketing researches. It allows to identify and structure the strengths and weaknesses of an enterprise, as well as potential opportunities and threats of the market, to make conclusion in which direction a given organization needs to develop its business and to formulate the organization's strategy. Use the ConceptDraw MINDMAP software and offered SWOT analysis templates for easy holding SWOT analysis for your company. This Mind Map displays the SWOT analysis for a company and variety of performance measures that influence its work.Flowchart Definition
Flowchart definition - A Flowchart is a diagram that graphically represents the structure of the system, the flow of steps in a process, algorithm, or the sequence of steps and decisions for execution a process or solution a problem. For depiction the steps there are used specific shapes and graphic symbols which are linked by lines and directional arrows. The main standard shapes are rectangle or box, rounded box, diamond, circle. A Flowchart is a convenient way to observe the follow the process from beginning to end, it lets improve the work of process, highlight the key elements and detach not essential or even excessive steps. The Flowcharts can represent different levels of detail: High-Level Flowchart, Detailed Flowchart, and Deployment or Matrix Flowchart. They are incredibly useful for programmers when developing the programs of any complexity and on any high level language. Create your own Flowcharts using the ConceptDraw DIAGRAM diagramming and vector drawing software and powerful tools of Flowcharts solution from "Diagrams" area.Bar Diagrams for Problem Solving. Create manufacturing and economics bar charts with Bar Graphs Solution
Create bar charts for visualizing problem solving in manufacturing and economics using the ConceptDraw DIAGRAM diagramming and vector drawing software extended with the Bar Graphs Solution from the Graphs and Charts area of ConceptDraw Solition Park.
Active Directory Diagrams
Active Directory Diagrams solution significantly extends the capabilities of ConceptDraw DIAGRAM software with special Active Directory samples, convenient template and libraries of Active Directory vector stencils, common icons of sites and services, icons of LDPA elements, which were developed to help you in planning and modelling network structures and network topologies, in designing excellently looking Active Directory diagrams, Active Directory Structure diagrams, and Active Directory Services diagram, which are perfect way to visualize detailed structures of Microsoft Windows networks, Active Directory Domain topology, Active Directory Site topology, Organizational Units (OU), and Exchange Server organization.
- National Park Service - Org chart
- Org Chart Diagram | National Park Service - Org chart | Horizontal ...
- National Park Service - Org chart | Organizational Charts ...
- National Park Service - Org chart | Marketing and Sales ...
- Orgchart | 25 Typical Orgcharts | Org Chart Diagram | Orgchart
- Organogram Of National Park
- Organogram Diagram Of National Park Service In Nigeria
- Organization Chart Templates | Hierarchical org chart 15 - Template ...
- Block diagram - Gap model of service quality | Service -goods ...
- Process Flowchart | Business Processes | Copying Service Process ...
