Venn Diagram Examples for Problem Solving. Computer Science. Chomsky Hierarchy

The Venn diagram example below visualizes the the class of language inclusions described by the Chomsky hierarchy.
 Venn Diagrams
Venn Diagrams are actively used to illustrate simple set relationships in set theory and probability theory, logic and statistics, mathematics and computer science, linguistics, sociology, and marketing. Venn Diagrams are also often used to visually summarize the status and future viability of a project.
Venn Diagram

Venn Diagram Examples for Problem Solving . Quantum Information Science. BQP Complexity

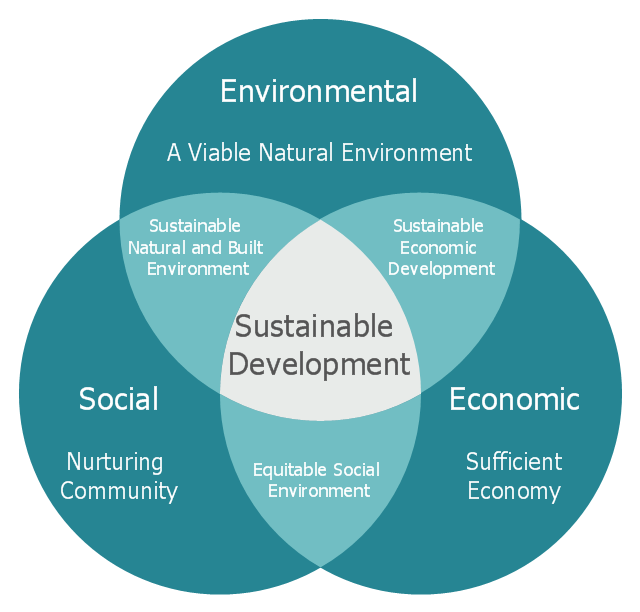
"Sustainable development is an organizing principle for human life on a finite planet. It posits a desirable future state for human societies in which living conditions and resource-use meet human needs without undermining the sustainability of natural systems and the environment, so that future generations may also have their needs met.
Sustainable development ties together concern for the carrying capacity of natural systems with the social and economic challenges faced by humanity. As early as the 1970s, 'sustainability' was employed to describe an economy "in equilibrium with basic ecological support systems." Scientists in many fields have highlighted The Limits to Growth, and economists have presented alternatives, for example a 'steady state economy', to address concerns over the impacts of expanding human development on the planet." [Sustainable development. Wikipedia]
The Venn diagram example "Path to sustainable development" was created using the ConceptDraw PRO diagramming and vector drawing software extended with the Venn Diagrams solution from the area "What is a Diagram" of ConceptDraw Solution Park.
Venn diagram
Venn Diagram Template for Word

The vector stencils library "Venn diagrams" contains 12 templates of Venn and Euler diagrams.
Use these shapes to draw your Venn and Euler diagrams in the ConceptDraw PRO diagramming and vector drawing software extended with the Venn Diagrams solution from the area "What is a Diagram" of ConceptDraw Solution Park.
Use these shapes to draw your Venn and Euler diagrams in the ConceptDraw PRO diagramming and vector drawing software extended with the Venn Diagrams solution from the area "What is a Diagram" of ConceptDraw Solution Park.
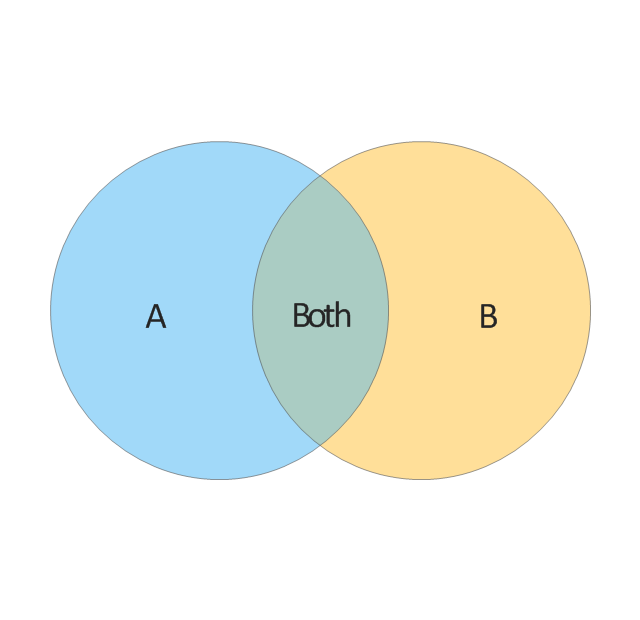
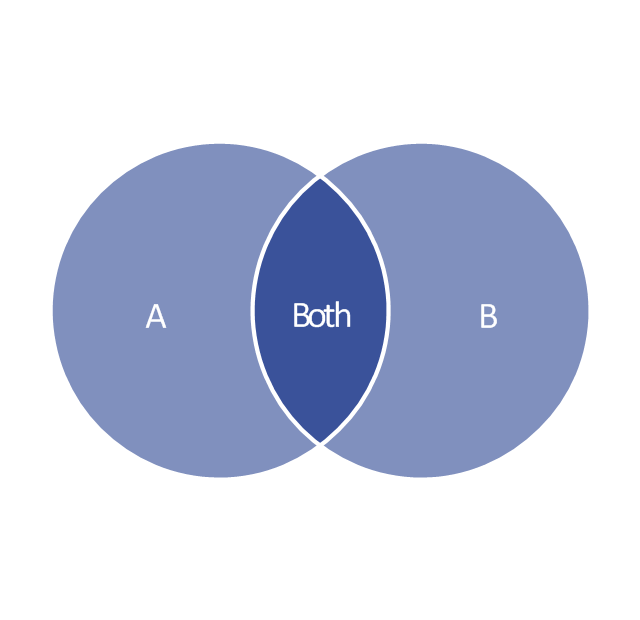
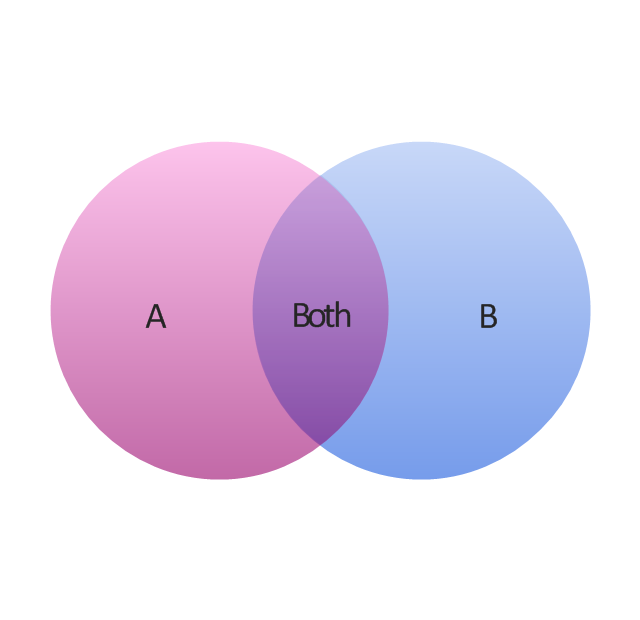
2-set Venn diagram
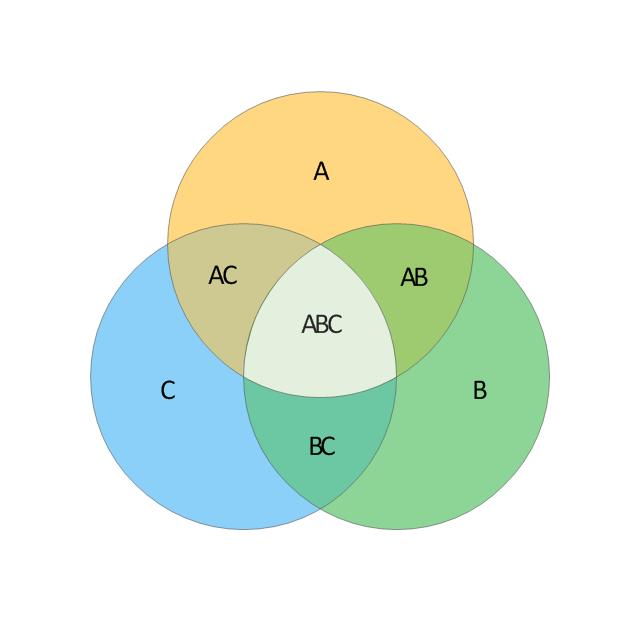
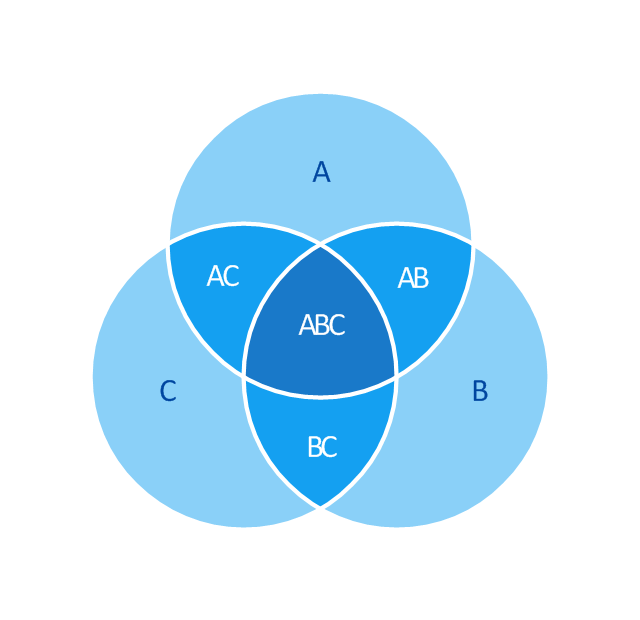
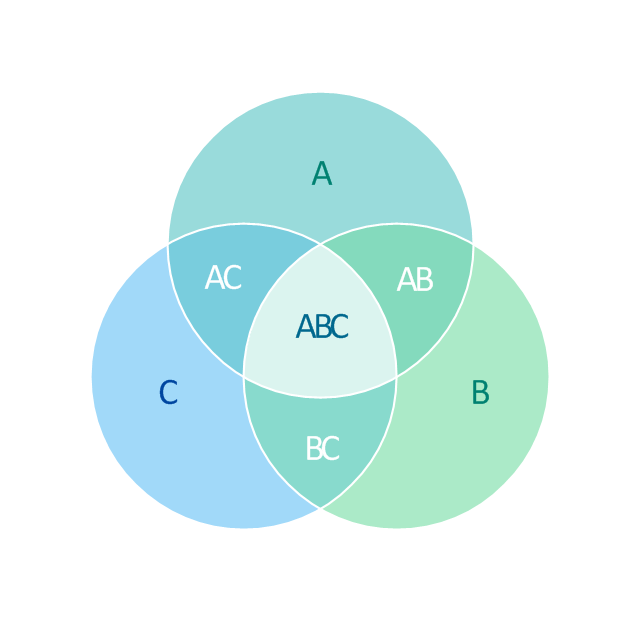
3-set Venn diagram
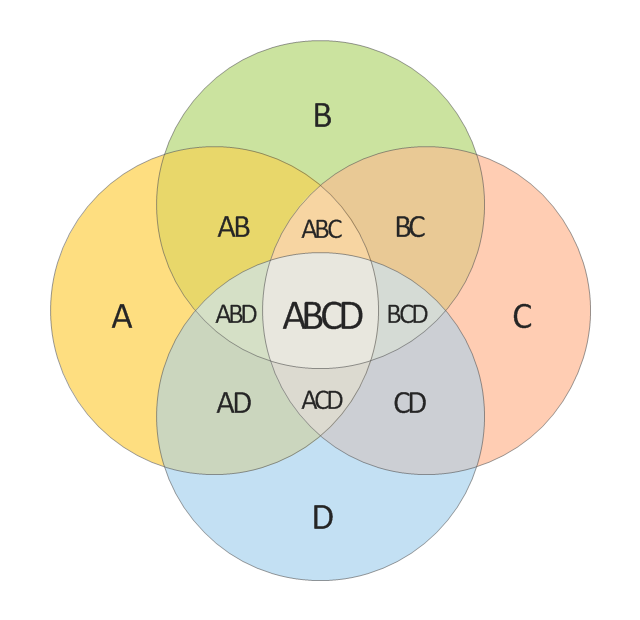
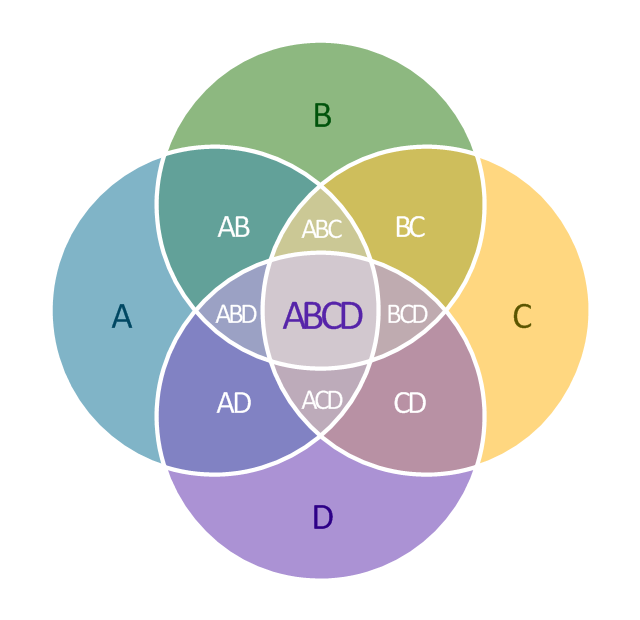
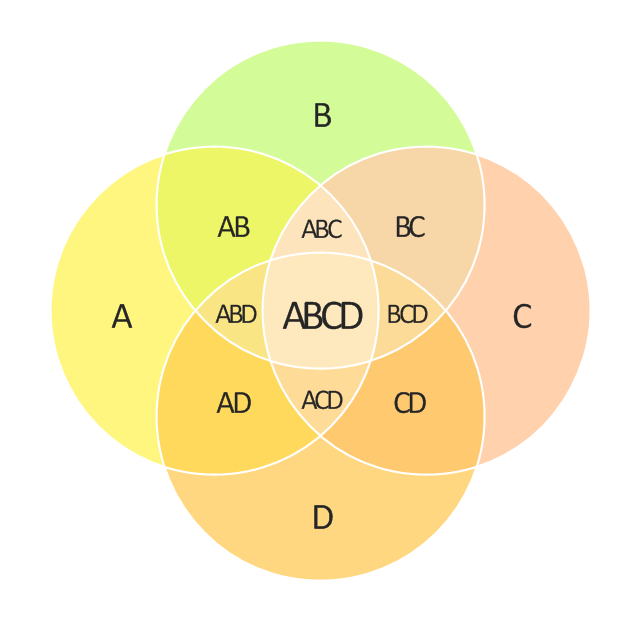
4-set Venn diagram
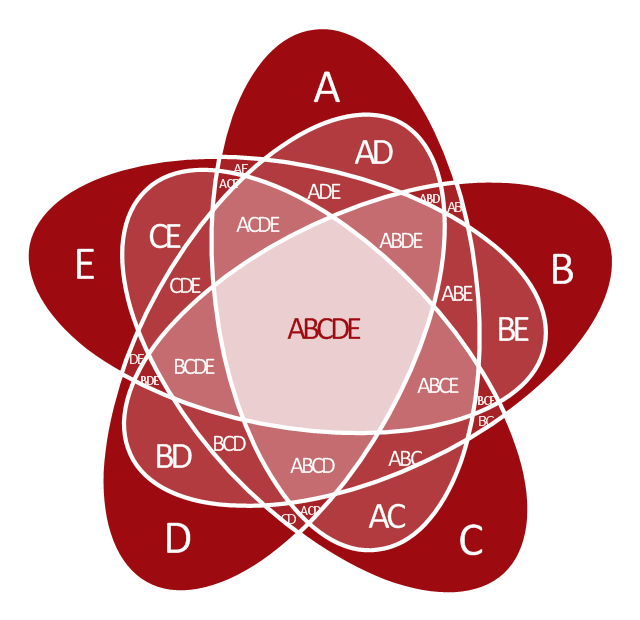
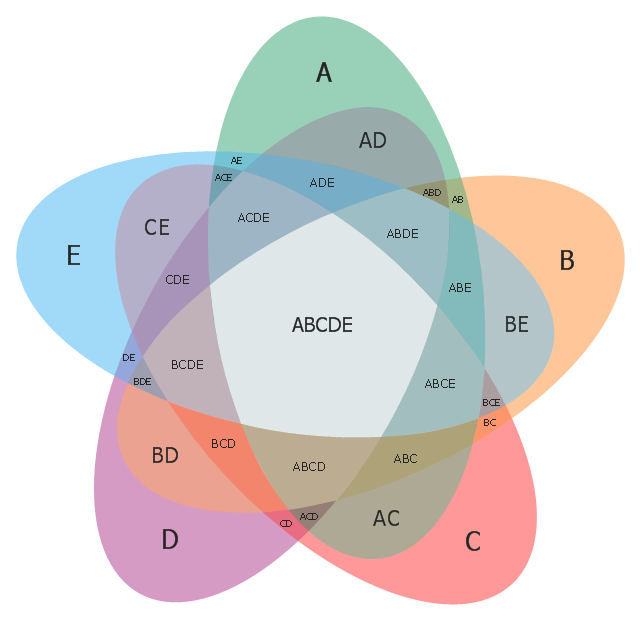
5-set Venn diagram

2-set Venn diagram
3-set Venn diagram
4-set Venn diagram
5-set Venn diagram
2-set Venn diagram
3-set Venn diagram
4-set Venn diagram
5-set Venn diagram

HelpDesk
How to Create a Venn Diagram in ConceptDraw PRO

Venn Diagram Examples for Problem Solving. Environmental Social Science. Human Sustainability Confluence

Create your Venn diagrams for problem solving in environmental social science using the ConceptDraw PRO diagramming and vector drawing software extended with the Venn Diagrams solution from the area "What is a Diagram" of ConceptDraw Solution Park.
Multi Layer Venn Diagram. Venn Diagram Example

Cylinder Venn Diagram

"Five-set Venn diagram using congruent ellipses in a radially symmetrical arrangement devised by Branko Grünbaum. Labels have been simplified for greater readability." [Venn diagram. Wikipedia]
This 5-set Venn diagram template for the ConceptDraw PRO diagramming and vector drawing software is included in the Venn Diagrams solution from the area "What is a Diagram" of ConceptDraw Solution Park.
This 5-set Venn diagram template for the ConceptDraw PRO diagramming and vector drawing software is included in the Venn Diagrams solution from the area "What is a Diagram" of ConceptDraw Solution Park.
Venn diagram
Venn Diagrams

ConceptDraw PRO diagramming and vector drawing software extended with Venn Diagrams solution from "What is a Diagram" area offers set of useful drawing tools for easy creating the Venn Diagrams for any quantity of sets.
3 Circle Venn Diagram. Venn Diagram Example

Venn Diagrams visualize all possible logical intersections between several sets and are widely used in mathematics, logic, statistics, marketing, sociology, etc.
Venn Diagram Template

- Venn Diagrams | Block diagram - Six markets model | Venn Diagram ...
- Venn Diagram Model Of Sustainable Development
- Venn diagram - Relationship marketing | Block diagram - Six ...
- 5-Set Venn diagram - Template | 5 Level pyramid model diagram ...
- 4 Level pyramid model diagram - Information systems types | Venn ...
- 4-Set Venn diagram - Template | Pyramid Diagram | 4 Level pyramid ...
- Venn Diagram | Venn Diagrams | Entity-Relationship Diagram (ERD ...
- Venn Diagrams | Venn Diagram | Entity-Relationship Diagram (ERD ...
- Venn Diagrams | Venn Diagram Examples | Venn Diagram ...
- Models Of Venn Diagram
- ConceptDraw Solution Park | Process Flowchart | Venn Diagrams ...
- Triangular Venn diagram - Template | Pyramid Diagram and ...
- Pyramid Diagram | 3 Circle Venn Diagram . Venn Diagram Example ...
- Venn Diagram Examples for Problem Solving. Venn Diagram as a ...
- ORM Diagram | Venn Diagram Examples | Software Diagram ...
- Venn Diagrams | Venn Diagram | 5-Set Venn diagram - Template ...
- Venn diagrams - Vector stencils library | Functional Block Diagram ...
- Venn Diagram Examples for Problem Solving. Computer Science ...
- Process flow diagram (PFD) template | Context Diagram Template ...
- Venn diagram - Path to sustainable development | Process ...