This site uses cookies. By continuing to browse the ConceptDraw site you are agreeing to our Use of Site Cookies.
HelpDesk

How to Show the Relationship Between Topics

Any mind map contains topics that are arranged in a radial structure. It depicts the relation (semantic, causal, association, etc.) between the concepts, parts, and components of the main idea. In addition to the main connections that make the structure of a mind map, topics can be linked with other lines. ConceptDraw MINDMAP allows you to show the relationships between topics, which belong to different parts of the mind map structure, but also influence each other. Relationships help to show and organize complex interconnections between topics of mind map visually. Such communication is also very important - the mind map, where many topics are not related, tends to turn into a common text.

Concept Map

A concept map is a way of representing relationships between ideas, images, or words.
How to draw a Concept Map quick, easy and effective? ConceptDraw DIAGRAM offers the unique Concept Maps Solution from the "Diagrams" Area that will help you!

Relations Diagram

Identify how factors influence each other. Factors mostly influencing called “Drivers” Primarily affected factors called “Indicators”. Problem solving further focuses on changing driver factors by corrective actions. Indicator factors help establish KPI (Key Performance Indicators) to monitor changes and the effectiveness of corrective actions in resolving a problem.

Concept Maps

As concept map consists from conception-blocks and links between them, you can use ConceptDraw library objects and add to a document as much objects as you need. ConceptDraw tools let you to edit, group, move objects, change their appearance and add text signs and raster or vector pictures.
ConceptDraw DIAGRAM diagramming and vector drawing software extended with Concept Maps Solution from the "Diagrams" Area is effective tool for creating professional looking Concept Maps.

What Is a Concept Map

What is a Concept Map and what software is effective for its design? A concept map or conceptual diagram is a diagram that depicts suggested relationships between concepts. As for effective software - we suggest you to pay attention for the ConceptDraw DIAGRAM diagramming and vector drawing software. Extended with Concept Maps Solution from the "Diagrams" Area it is a real godsend for you.
HelpDesk

How to Create a Concept Map

The graphical technique of knowledge representation in the form of structured networks of concepts (ideas) is called concept mapping. Concept network consists of shapes that represent concepts and connectors representing relationships between concepts. The difference between mind maps and concept maps is that a mind map has only one object depicting the main idea, while a concept map may have several. Concept mapping is used to structure ideas, to communicate a complex system of knowledge, to help the learning process, etc. ConceptDraw DIAGRAM allows you to draw concept maps using the Concept Map solution.
HelpDesk

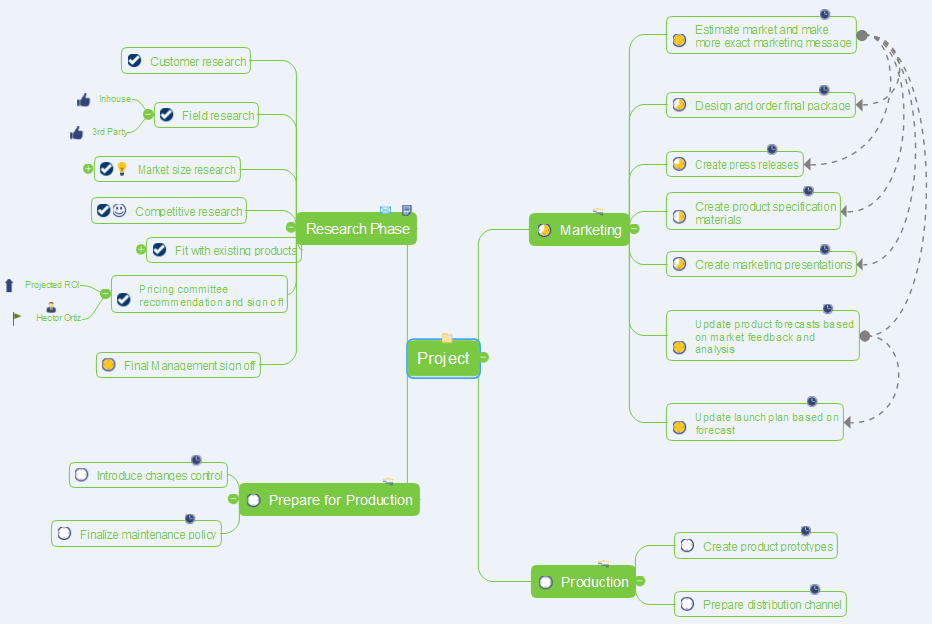
How to Make a Mind Map from a Project Gantt Chart

ConceptDraw Office allows you to see the project data from ConceptDraw PROJECT in a mind map structure by opening your project in ConceptDraw MINDMAP.
HelpDesk

How to Make a Project Tasks Mind Map from Brainstorm

Start a project with creating a mind map, structuring ideas captured during a brainstorming session. The easiest way to start a new project is to conduct a brainstorming session that identifies the necessary tasks and then to develop it into a project schedule.

Product Overview

The role of ConceptDraw MINDMAP is to organize and plan idea development and communicate between process participants. Mind maps are convenient to prepare presentations for team and management and send task lists and related information.

Affinity Diagram

The Affinity Diagram shows the structure of large, complex factors that have an influence on a problem, and then divides them up into a smaller and simpler structure. The Affinity Diagram does not show a causal relationship between the factors. This diagram is designed to prepare the data for further analysis of the cause-effect relationships.