 ConceptDraw Solution Park
ConceptDraw Solution Park collects graphic extensions, examples and learning materials
Create Response Charts

Design Data Flow. DFD Library

HelpDesk
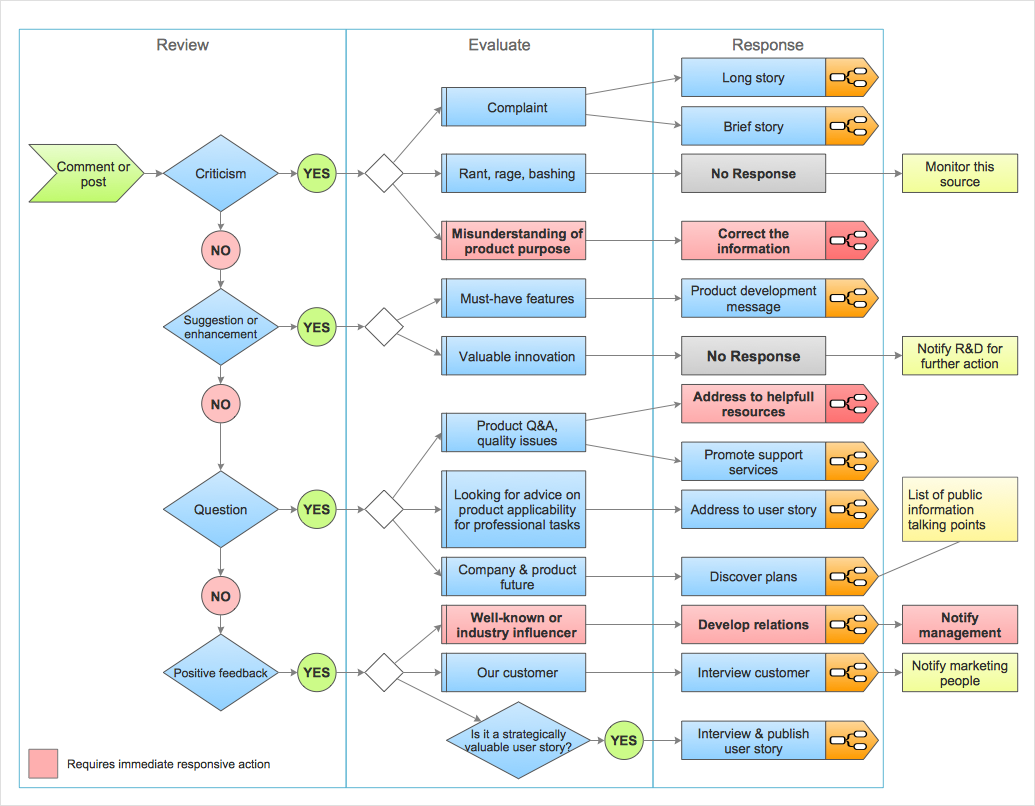
How to Organize a Social Media Activity
HelpDesk
How to Add conceptdraw.com Domain to Custom Safe Senders List

HelpDesk
How to Send an Outlook Email From a Mind Map

HelpDesk
How to Create Data-Driven Infographics

HelpDesk
How to Send a Mind Map Branch to Evernote

HelpDesk
How to Send a Mind Map File to Evernote

HelpDesk
Download and Install ConceptDraw OFFICE on Mac
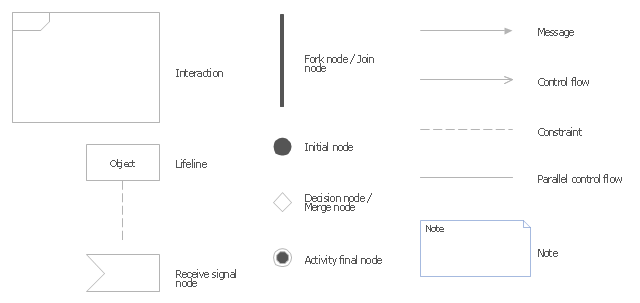
The vector stencils library "UML interaction overview diagrams" contains 13 symbols for the ConceptDraw PRO diagramming and vector drawing software.
"Interaction Overview Diagram is one of the fourteen types of diagrams of the Unified Modeling Language (UML), which can picture a control flow with nodes that can contain interaction diagrams.
The interaction overview diagram is similar to the activity diagram, in that both visualize a sequence of activities. The difference is that, for an interaction overview, each individual activity is pictured as a frame which can contain a nested interaction diagrams." [Interaction overview diagram. Wikipedia]
"Interaction diagrams.
Interaction diagrams, a subset of behavior diagrams, emphasize the flow of control and data among the things in the system being modeled:
(1) Communication diagram: shows the interactions between objects or parts in terms of sequenced messages. They represent a combination of information taken from Class, Sequence, and Use Case Diagrams describing both the static structure and dynamic behavior of a system.
(2) Interaction overview diagram: provides an overview in which the nodes represent interaction diagrams.
(3) Sequence diagram: shows how objects communicate with each other in terms of a sequence of messages. Also indicates the lifespans of objects relative to those messages.
(4) Timing diagrams: a specific type of interaction diagram where the focus is on timing constraints." [Unified Modeling Language. Wikipedia]
The example "Design elements - UML interaction overview diagrams" is included in the Rapid UML solution from the Software Development area of ConceptDraw Solution Park.
UML interaction overview diagram symbols
- Design elements - Valve assembly | Flow Chart Symbols | Design ...
- Flow Chart Symbols | Basic Flowchart Symbols | Best Flowchart ...
- Basic Flowchart Symbols | Data Flow Diagram Symbols . DFD ...
- Basic Flowchart Symbols - Conceptdraw.com
- Create a Flow Chart - Conceptdraw.com
- Swim Lane Diagrams | Cross-Functional Flowchart (Swim Lanes ...
- Basic Flowchart Symbols | Flow Chart Symbols | Process Flowchart ...
- Workflow Diagram Symbols | Graphical Symbols to use in EPC ...
- Business Process Modeling with ConceptDraw | Flow Chart Symbols
- ERD Symbols and Meanings | Entity Relationship Diagram Symbols ...
- Types of Flowchart - Overview | Basic Flowchart Symbols | Workflow ...
- DFD Library System | Data Flow Diagram Symbols . DFD Library ...
- Symbol for Pool Table for Floor Plans | Design elements ...
- Flowchart design. Flowchart symbols , shapes, stencils and icons ...
- Flow Chart Symbols | Process Flowchart | Basic Flowchart Symbols ...
- Event-driven Process Chain Diagrams EPC | Basic Flowchart ...
- Process Flowchart | Flowchart Software | Basic Flowchart Symbols ...
- Design elements - Swimlanes BPMN 2.0 | Business process swim ...
- ConceptDraw Arrows10 Technology | Connecting to databases with ...
- How to Create a Social Media DFD Flowchart | Basic Flowchart ...