UML Class Diagram Example - Medical Shop

DFD Flowchart Symbols

Work Process

Percentage Pie Chart. Pie Chart Examples

UML Flowchart Symbols

Components of ER Diagram

Metropolitan area networks (MAN). Computer and Network Examples
. Computer and Network Examples")

How to create a UML Diagram

Credit Card Processing System UML Diagram

 Pharmacy Illustrations
Pharmacy Illustrations solution with improbable quantity of predesigned vector objects and icons of pharmacy symbols, medical and health products, pharmacy images of drugstore products, pharmacy clipart of medication tools, pharmacy logo, and other pharmacy pictures is the best for designing the pharmacy illustrations of varied kinds, pharmacy and medical diagrams and schematics, for making the presentation slides and posters on the medical, pharmacy, pharmacology and pharmaceutical thematics, for designing the illustrative materials about ways of prevention diseases and also treatment them, for creation colorful illustrations helpful in newborn and baby care, the infographics and collages to be presented at the premises of medical establishments and during the lectures at the medical education institutions, also on the billboards and in other advertising materials.
 Health Informatics
Health Informatics solution supplies the ConceptDraw DIAGRAM with tools and functionalities in a field of healthcare design and healthcare informatics. Including collection of professionally designed samples and a lot of high-quality health informatics vector design objects, it is the best for all medical workers and healthcare-related specialties when designing diagrams, schematics, flow charts, workflow charts, block diagrams, infographics, illustrations, and presentations slides in a field of Health Informatics, representing the newest medical information technologies, architectures of healthcare systems, principles of work of the specialized software, structures of health records systems, medical researches processes.
Design Element: Rack Diagram for Network Diagrams
.png "Design Element: Rack Diagram<br>for Network Diagrams *")
Guesthouse Network

Design Pictorial Infographics. Design Infographics

Cafe Floor Plan. Cafe Floor Plan Examples

The vector stencils library "HR professions" contains 81 professions pictograms.
Use this HR icon set to draw your HR flowcharts, workflow diagrams, process charts and infographics with the ConceptDraw PRO diagramming and vector drawing software.
The HR pictograms library "HR professions" is included in the HR Flowcharts solution from the Management area of ConceptDraw Solution Park.
Accountant

Actor

Administrator

Announcer

Archaeologist

Architect

Artist

Baker

Banker

Bellboy

Biologist

Bookkeeper

Builder

Businessman

Businesswoman

Call center operator

Cameraman

Carpenter

Cashier

Chef

Chemist

Cleaner

Clerk

Consultant

Cook

Dentist

Director

Dispatcher

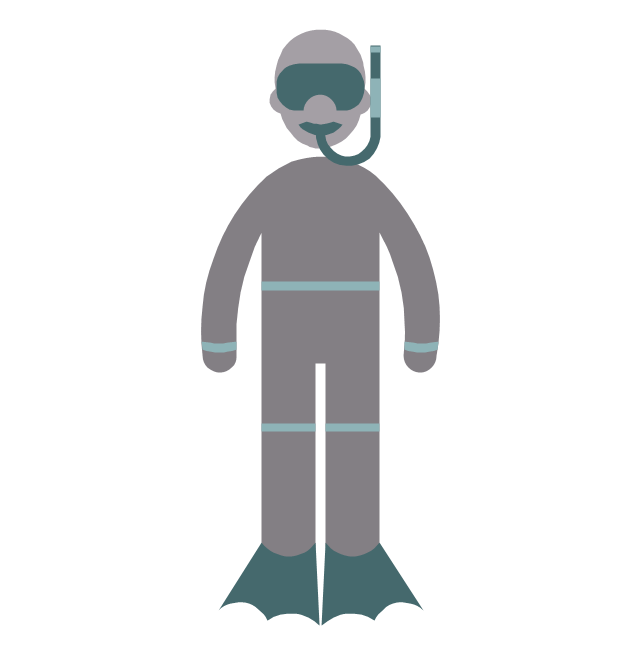
Diver
Doctor

Driver

Electrical engineer

Engineer

Environmental engineer

Farmer

Firefighter

Fisherman

Florist

Gardener

Graphic designer

Guide

Hairdresser

Lawyer

Librarian

Machine operator

Manager

Miner

Movie director

Musician

Nuclear engineer

Nurse

Pharmacist

Photographer

Pilot

Pizza delivery man

Policeman

Postman

Presenter

Programmer

Psychologist

Reporter

Sailor

Scientist

Secretary

Security guard

Security officer

Seller

Shop assistant

Soldier

Stewardess

Surgeon

System administrator

Systems engineer

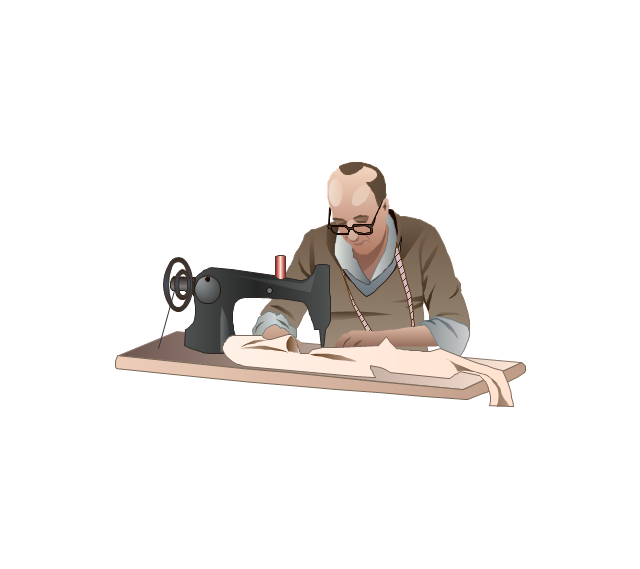
Tailor

Teacher

Technical support representative

Waiter

Waitress

Watchman

Worker

Writer

 Network Layout Floor Plans
Network Layout Floor Plans solution extends ConceptDraw DIAGRAM software functionality with powerful tools for quick and efficient documentation the network equipment and displaying its location on the professionally designed Network Layout Floor Plans. Never before creation of Network Layout Floor Plans, Network Communication Plans, Network Topologies Plans and Network Topology Maps was not so easy, convenient and fast as with predesigned templates, samples, examples and comprehensive set of vector design elements included to the Network Layout Floor Plans solution. All listed types of plans will be a good support for the future correct cabling and installation of network equipment.
Types of Flowchart — Overview


Data Flow Diagram

The vector stencils library "Professions" contains 58 people clipart images of different professions you can use in your presentations, illustrations and infographics.
"Electronic clip art is available in several different file formats. It is important for clip art users to understand the differences between file formats so that they can use an appropriate image file and get the resolution and detail results they need.
Clip art file formats are divided into 2 different types: bitmap or vector graphics. ...
In contrast to the grid format of bitmap images, Vector graphics file formats use geometric modeling to describe an image as a series of points, lines, curves, and polygons. Because the image is described using geometric data instead of fixed pixels, the image can be scaled to any size while retaining "resolution independence", meaning that the image can be printed at the highest resolution a printer supports, resulting in a clear, crisp image. Vector file formats are usually superior in resolution and ease of editing as compared to bitmap file formats, but are not as widely supported by software and are not well-suited for storing pixel-specific data such as scanned photographs. In the early years of electronic clip art, vector illustrations were limited to simple line art representations." [Clip art. Wikipedia]
The clip art example "Professions - Vector stencils library" was created using the ConceptDraw PRO diagramming and vector drawing software extended with the People solution from the Illustration area of ConceptDraw Solution Park.
www.conceptdraw.com/ solution-park/ illustrations-people
Builder 1

System administrator

Worker of conveyor

Clerk 1

Clerk 2

Student 2

Student 3

Student 1

Dispatcher 1

Accountant

Gardener

Lawyer

Jurist

Judge

Consultant

Manager

Director

Programmer

Architect

Pilot

Policeman

Secretary

Security officer

Clerk 3

Musician

Presenter

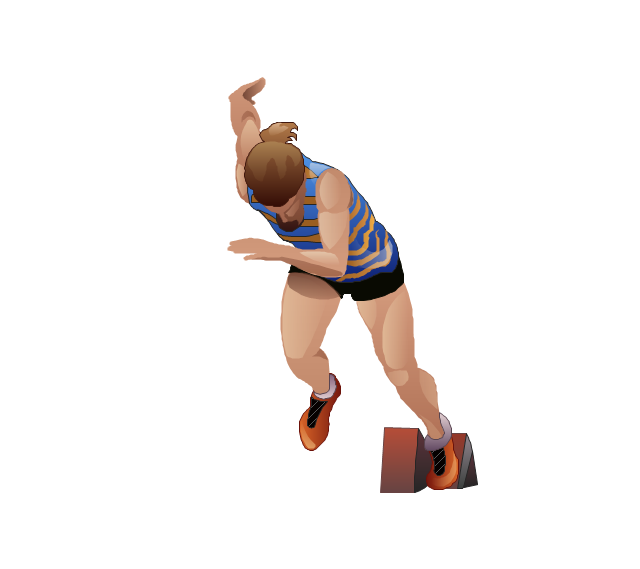
Athlete
Artist

Announcer

Photographer

Hairdresser

Florist

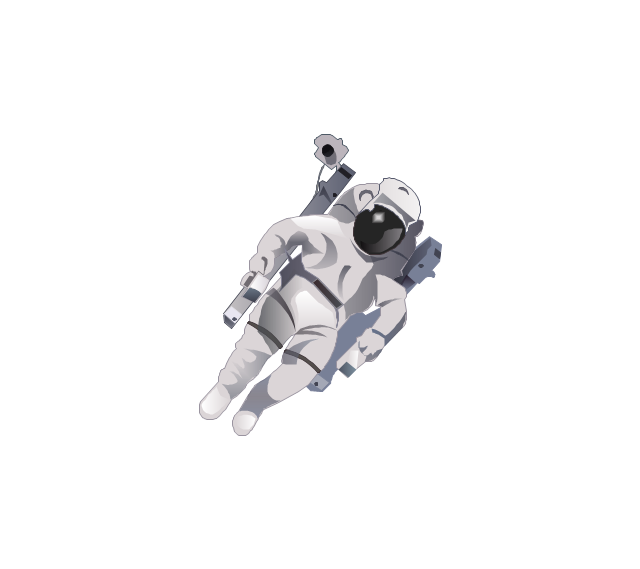
Spaceman
Engineer

Reporter

Tailor
Dispatcher 2

Biologist

Chemist

Dentist

Priest

Soldier

Doctor

Driver

Carpenter

Fireman

Seaman

Builder 2

Postman

Miner

Waiter

Cleaner

Cashier

Shop assistant

Cook

Flight attendant

Teacher

Hall porter

- UML Class Diagram Example - Medical Shop | Flow chart Example ...
- UML Class Diagram Example - Medical Shop | Entity Relationship ...
- Emergency medical responder process flow - Medical Shop
- UML Class Diagram Example - Medical Shop | Booch OOD Diagram ...
- UML Flowchart Symbols - Medical Shop | About UML
- Flow chart Example. Warehouse Flowchart - Medical Shop
- UML Class Diagram Example - Medical Shop | Example of DFD for ...
- UML Class Diagram Example - Medical Shop | Emergency medical ...
- Swim Lane Flowchart Symbols - Medical Shop | Swim Lane Diagrams
- Specification and Description Language (SDL) - Medical Shop