PROBLEM ANALYSIS. Root Cause Analysis Tree Diagram


Using Fishbone Diagrams for Problem Solving

SWOT Analysis Solution - Strategy Tools

SWOT Analysis Software

SWOT Matrix Template

 Fishbone Diagrams
The Fishbone Diagrams solution extends ConceptDraw DIAGRAM software with the ability to easily draw the Fishbone Diagrams (Ishikawa Diagrams) to clearly see the cause and effect analysis and also problem solving. The vector graphic diagrams produced using this solution can be used in whitepapers, presentations, datasheets, posters, and published technical material.
 SWOT Analysis
SWOT and TOWS Matrix Diagrams solution extends ConceptDraw DIAGRAM and ConceptDraw MINDMAP software with features, templates, samples and libraries of vector stencils for drawing SWOT and TOWS analysis matrices and mind maps.
SWOT Analysis

House of Quality Matrix Software

TOWS Matrix

Cause and Effect Analysis

SWOT Matrix

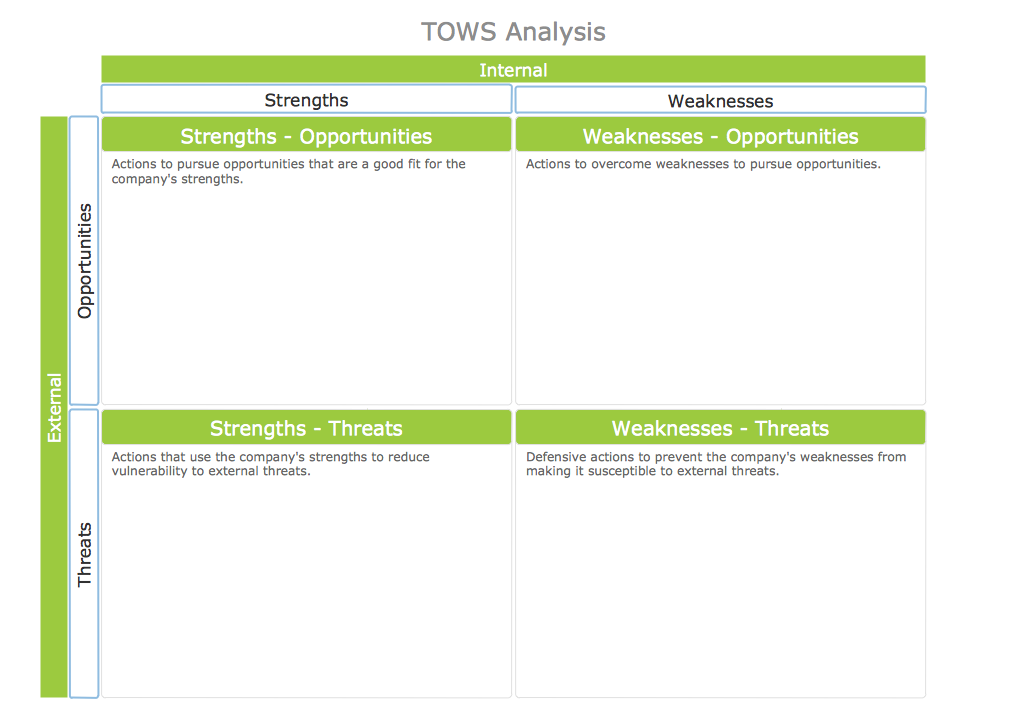
TOWS Analysis
SWOT Analysis Tool for Small Business

PROBLEM ANALYSIS. Identify and Structure Factors

- Fault Tree Analysis Diagrams | Process Flowchart | Fishbone ...
- PROBLEM ANALYSIS. Root Cause Analysis Tree Diagram | Using ...
- Fishbone Diagram | SWOT and TOWS Matrix Diagrams | Quality ...
- Marketing | SWOT analysis matrix diagram templates | Fishbone ...
- ConceptDraw Solution Park | SWOT and TOWS Matrix Diagrams ...
- Fishbone Diagram | Engineering | ConceptDraw Solution Park ...
- Fish Bone Matrix
- What is SWOT Analysis ? | SWOT analysis matrix diagram templates ...
- SWOT and TOWS Matrix Diagrams | Management | Fishbone ...
- TOWS Analysis | SWOT Matrix Software | Fault Tree Analysis ...
- SWOT Matrix Template | SWOT analysis matrix diagram templates ...
- Fishbone Diagram | SWOT Matrix Template | SWOT Template ...
- SWOT and TOWS Matrix Diagrams | Fishbone Diagram ...
- SWOT and TOWS Matrix Diagrams | Fault Tree Analysis Diagrams ...
- Cause and Effect Analysis ( Fishbone Diagrams) | New business ...
- Fishbone Diagram Strategic Planning
- Swot Analysis Definition Ppt
- SWOT and TOWS Matrix Diagrams | Fishbone Diagram | Education ...
- Fishbone Diagram | Seven Management and Planning Tools ...
- SWOT and TOWS Matrix Diagrams | SWOT Analysis | How to Create ...