Basic Diagramming


Mathematical Diagrams

Bar Diagram Math

Mathematics Symbols

HelpDesk
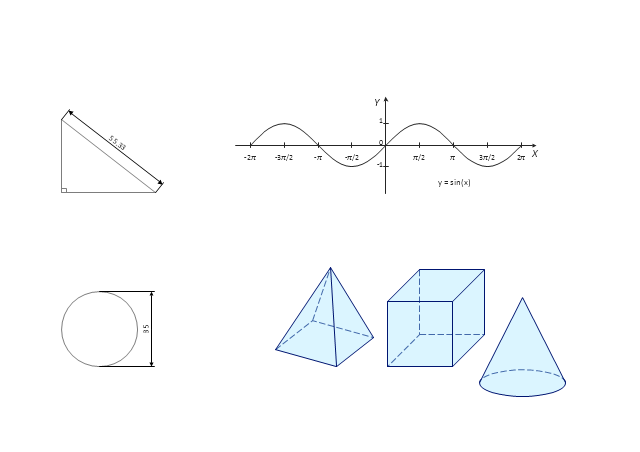
How to Draw Geometric Shapes in ConceptDraw PRO

Use this mathematical drawings and graphs template to create your own math illustrations using the shapes of plane and solid geometric figures as well as trigonometric functions.
"Mathematical visualization or mathematical visualization is an aspect of geometry which allows one to understand and explore mathematical phenomena via visualization. Classically this consisted of two-dimensional drawings or building three-dimensional models (particularly plaster models in the 19th and early 20th century), while today it most frequently consists of using computers to make static two or three dimensional drawings, animations, or interactive programs. Writing programs to visualize mathematics is an aspect of computational geometry." [Mathematical visualization. Wikipedia]
The math illustrations template for the ConceptDraw PRO diagramming and vector drawing software is included in the Mathematics solution from the Science and Education area of ConceptDraw Solution Park.
Mathematical drawings and graphs

Basic Flowchart Symbols and Meaning


Process Diagrams

Simple Drawing Applications for Mac

Venn Diagram Examples for Problem Solving. Environmental Social Science. Human Sustainability Confluence

Bar Diagrams for Problem Solving. Create space science bar charts with Bar Graphs Solution

UML State Machine Diagram.Design Elements

The Best Drawing Program for Mac

Best Vector Drawing Application for Mac OS X

- Concept Draw Sample Of Math
- Basic Diagramming | Mathematical Diagrams | How to Draw ...
- Vector Draw Tool Math
- Mathematical Drawing Software
- Software For Drawing Mathematical Diagrams
- Math illustrations - Template | Mathematical Diagrams | Scientific ...
- Education | Basic Diagramming | Mathematics | Math Vectors Mind ...
- How to Draw Geometric Shapes in ConceptDraw PRO ...
- Mathematical Diagrams | Basic Diagramming | Mathematics ...
- Bar Diagram Math | Mathematical Diagrams | Basic Diagramming ...
- Basic Diagramming | Mathematics | Bar Diagram Math | Math Mind ...
- Basic Diagramming | Bar Diagram Math | Mathematical Diagrams ...
- Englneering Drawing Math Solve
- Drawing Math Project On Calendar On Chart
- A In Mathematical Drawings
- Mathematical Diagrams | Mathematics Symbols | Math illustrations ...
- Mathematical Diagrams | Mathematics Symbols | Scientific Symbols ...
- Basic Diagramming | Mathematics | Mind Map Exchange | Mind Map ...
- Basic Diagramming | Mathematics | How to Draw Geometric Shapes ...
- Mathematics Symbols | Mathematical Diagrams | Scientific Symbols ...