 Marketing Diagrams
Marketing Diagrams solution extends ConceptDraw DIAGRAM diagramming software with abundance of samples, templates and vector design elements intended for easy graphical visualization and drawing different types of Marketing diagrams and graphs, including Branding Strategies Diagram, Five Forces Model Diagram, Decision Tree Diagram, Puzzle Diagram, Step Diagram, Process Chart, Strategy Map, Funnel Diagram, Value Chain Diagram, Ladder of Customer Loyalty Diagram, Leaky Bucket Diagram, Promotional Mix Diagram, Service-Goods Continuum Diagram, Six Markets Model Diagram, Sources of Customer Satisfaction Diagram, etc. Analyze effectively the marketing activity of your company and apply the optimal marketing methods with ConceptDraw DIAGRAM software.
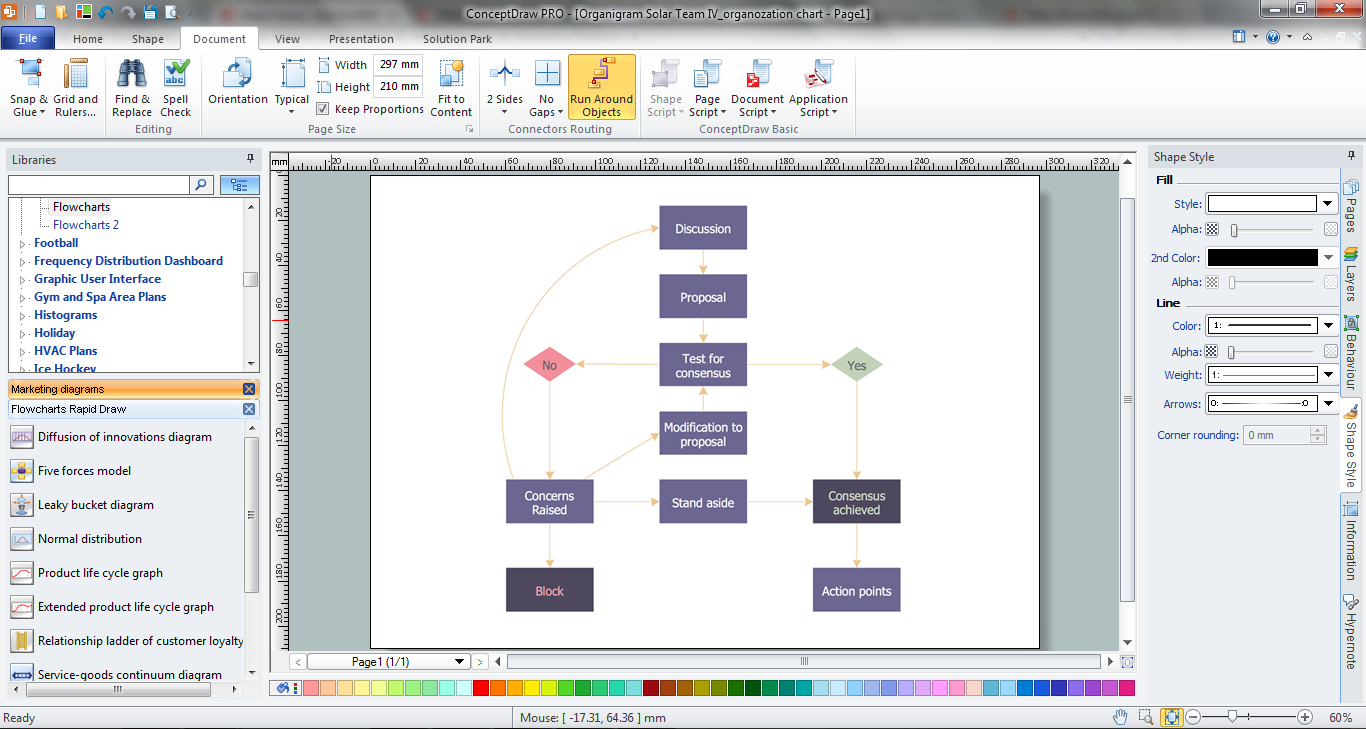
Flowchart Marketing Process. Flowchart Examples

Pyramid Chart Examples

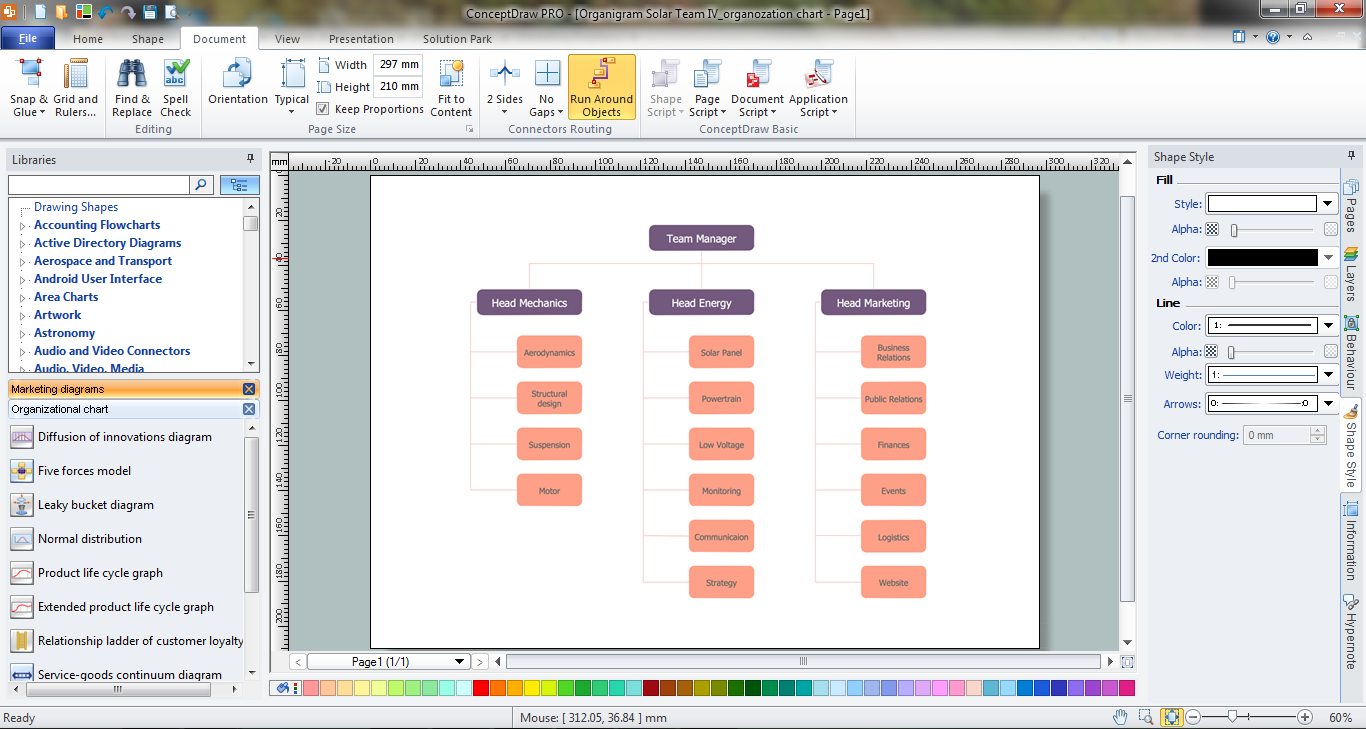
Marketing Organization Chart
Marketing Flow Chart
Marketing Charts

Marketing Analysis Diagram

Flowchart Example: Flow Chart of Marketing Analysis

Marketing and Sales Organization chart. Organization chart Example

 Target and Circular Diagrams
This solution extends ConceptDraw DIAGRAM software with samples, templates and library of design elements for drawing the Target and Circular Diagrams.
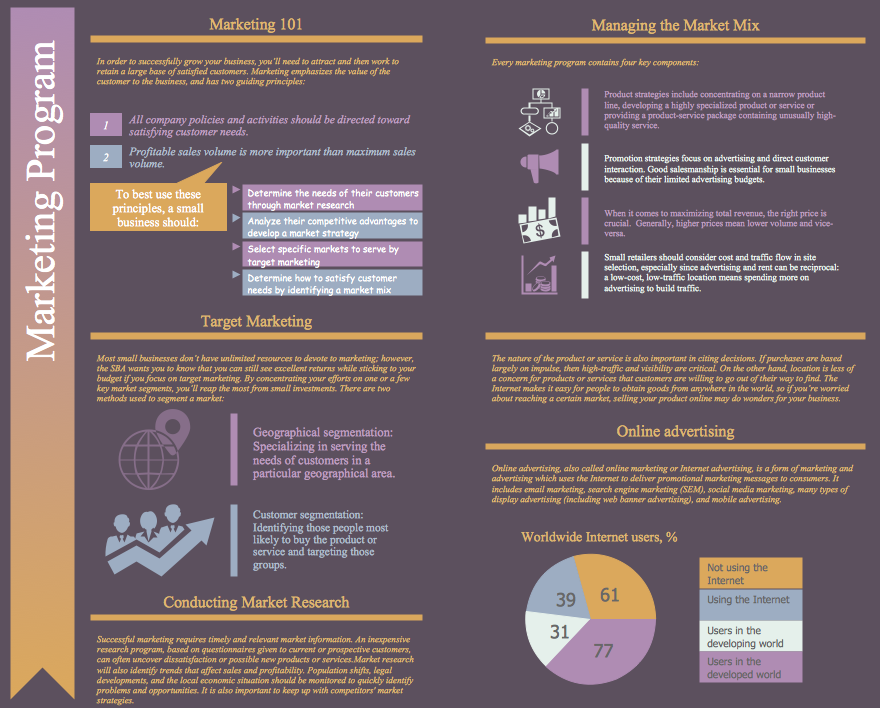
Marketing Plan Infographic
Market Chart
Gant Chart in Project Management


 Marketing
This solution extends ConceptDraw DIAGRAM and ConceptDraw MINDMAP with Marketing Diagrams and Mind Maps (brainstorming, preparing and holding meetings and presentations, sales calls).
 Pyramid Diagrams
Pyramid Diagrams solution extends ConceptDraw DIAGRAM software with templates, samples and library of vector stencils for drawing the marketing pyramid diagrams.
 Venn Diagrams
Venn Diagrams are actively used to illustrate simple set relationships in set theory and probability theory, logic and statistics, mathematics and computer science, linguistics, sociology, and marketing. Venn Diagrams are also often used to visually summarize the status and future viability of a project.
 Event-driven Process Chain Diagrams
Event-Driven Process Chain Diagrams solution extends ConceptDraw DIAGRAM functionality with event driven process chain templates, samples of EPC engineering and modeling the business processes, and a vector shape library for drawing the EPC diagrams and EPC flowcharts of any complexity. It is one of EPC IT solutions that assist the marketing experts, business specialists, engineers, educators and researchers in resources planning and improving the business processes using the EPC flowchart or EPC diagram. Use the EPC solutions tools to construct the chain of events and functions, to illustrate the structure of a business process control flow, to describe people and tasks for execution the business processes, to identify the inefficient businesses processes and measures required to make them efficient.
Scatter Chart Examples

Six Markets Model Chart

- Marketing Flow Chart | Marketing Organization Chart | Flowchart ...
- Marketing Diagrams | Flowchart Marketing Process. Flowchart ...
- Flowchart Marketing Process. Flowchart Examples | Flowchart ...
- Service-goods continuum diagram | Pyramid Chart Examples ...
- Pyramid Diagrams | Pyramid Diagram | Pyramid Chart Examples ...
- Marketing Diagrams | Marketing Charts | Marketing Organization ...
- Marketing | ConceptDraw Solution Park | Pyramid Chart Examples ...
- Sample Marketing Flow Chart
- Marketing Diagrams | Pyramid Chart Examples | Flowchart ...
- Service-goods continuum diagram | Marketing Diagrams | Pyramid ...
- Marketing | Pyramid Chart Examples | Best Diagramming | Diagram ...
- Customer Marketing Diagram
- Marketing Flow Chart Sample
- Flowchart Marketing Process. Flowchart Examples | Sales Process ...
- Venn Diagram Examples | Venn Diagrams | Venn Diagram ...
- Marketing Diagrams | Pyramid Chart Examples | Service-goods ...
- Marketing Diagrams | Marketing Analysis Diagram | Marketing ...
- Venn diagram - Relationship marketing | Block diagram - Six ...
- Social strategy pyramid - Marketing diagram | Pyramid Chart ...
- Marketing Chart Software