ERD Symbols and Meanings


The vector stencils library "Value stream mapping" contains 43 VSM symbols.
Use it for drawing value stream maps in the ConceptDraw PRO diagramming and vector drawing software extended with the Value Stream Mapping solution from the Quality area of ConceptDraw Solution Park.
www.conceptdraw.com/ solution-park/ business-value-stream-mapping
Use it for drawing value stream maps in the ConceptDraw PRO diagramming and vector drawing software extended with the Value Stream Mapping solution from the Quality area of ConceptDraw Solution Park.
www.conceptdraw.com/ solution-park/ business-value-stream-mapping
Inventory
Inventory

Information Flow
Shipment
Shipment
Material Flow
Material Pull
FIFO Line
Truck shipment/Logistics
Customer/Supplier
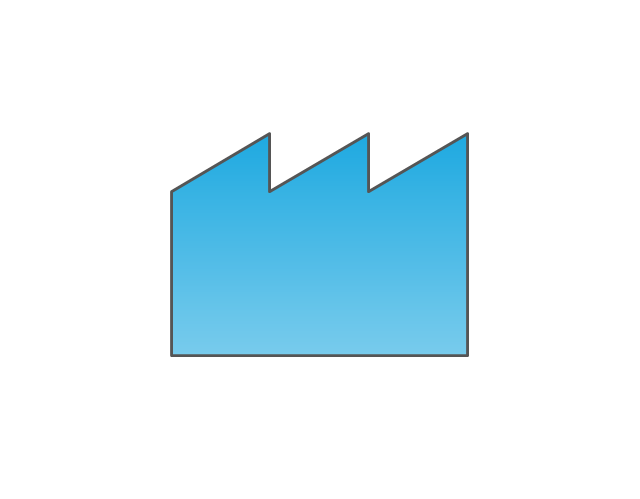
Dedicated Process

Shared Process
Supermarket Parts
Data Box
Workcell
Kaizen Burst

Operator
Other
Production Control
Manual Info
Electronic Information Flow
Production Kanban
Withdrawal Kanban
Signal Kanban
Kanban Post
Sequenced Pull
Load Levelling
MRP/ERP
Go-See
Pull Arrow
Manual Info
Pull Arrow
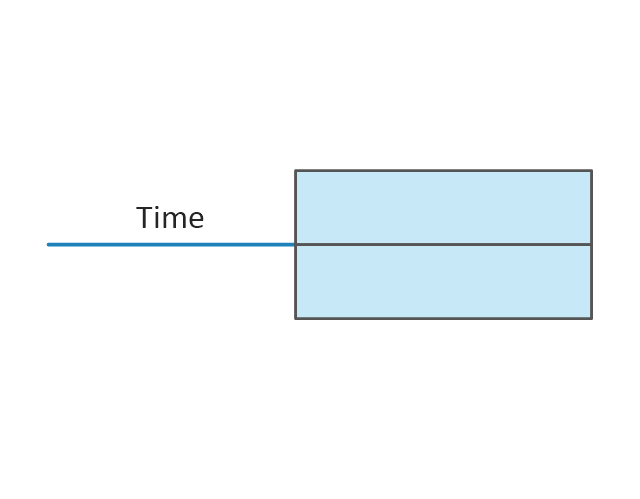
Timeline Total
Ship
Forklift Truck
Plane
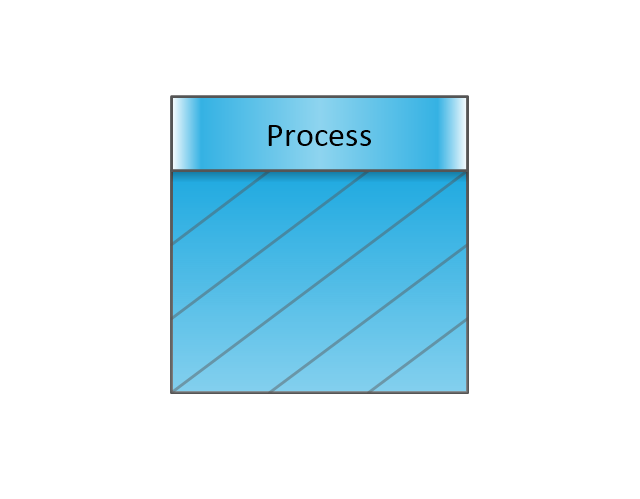
Process with Data
Timeline
Timeline
Supermarket, 2
Supermarket, 3
Safety stock, 2
Safety stock, 3
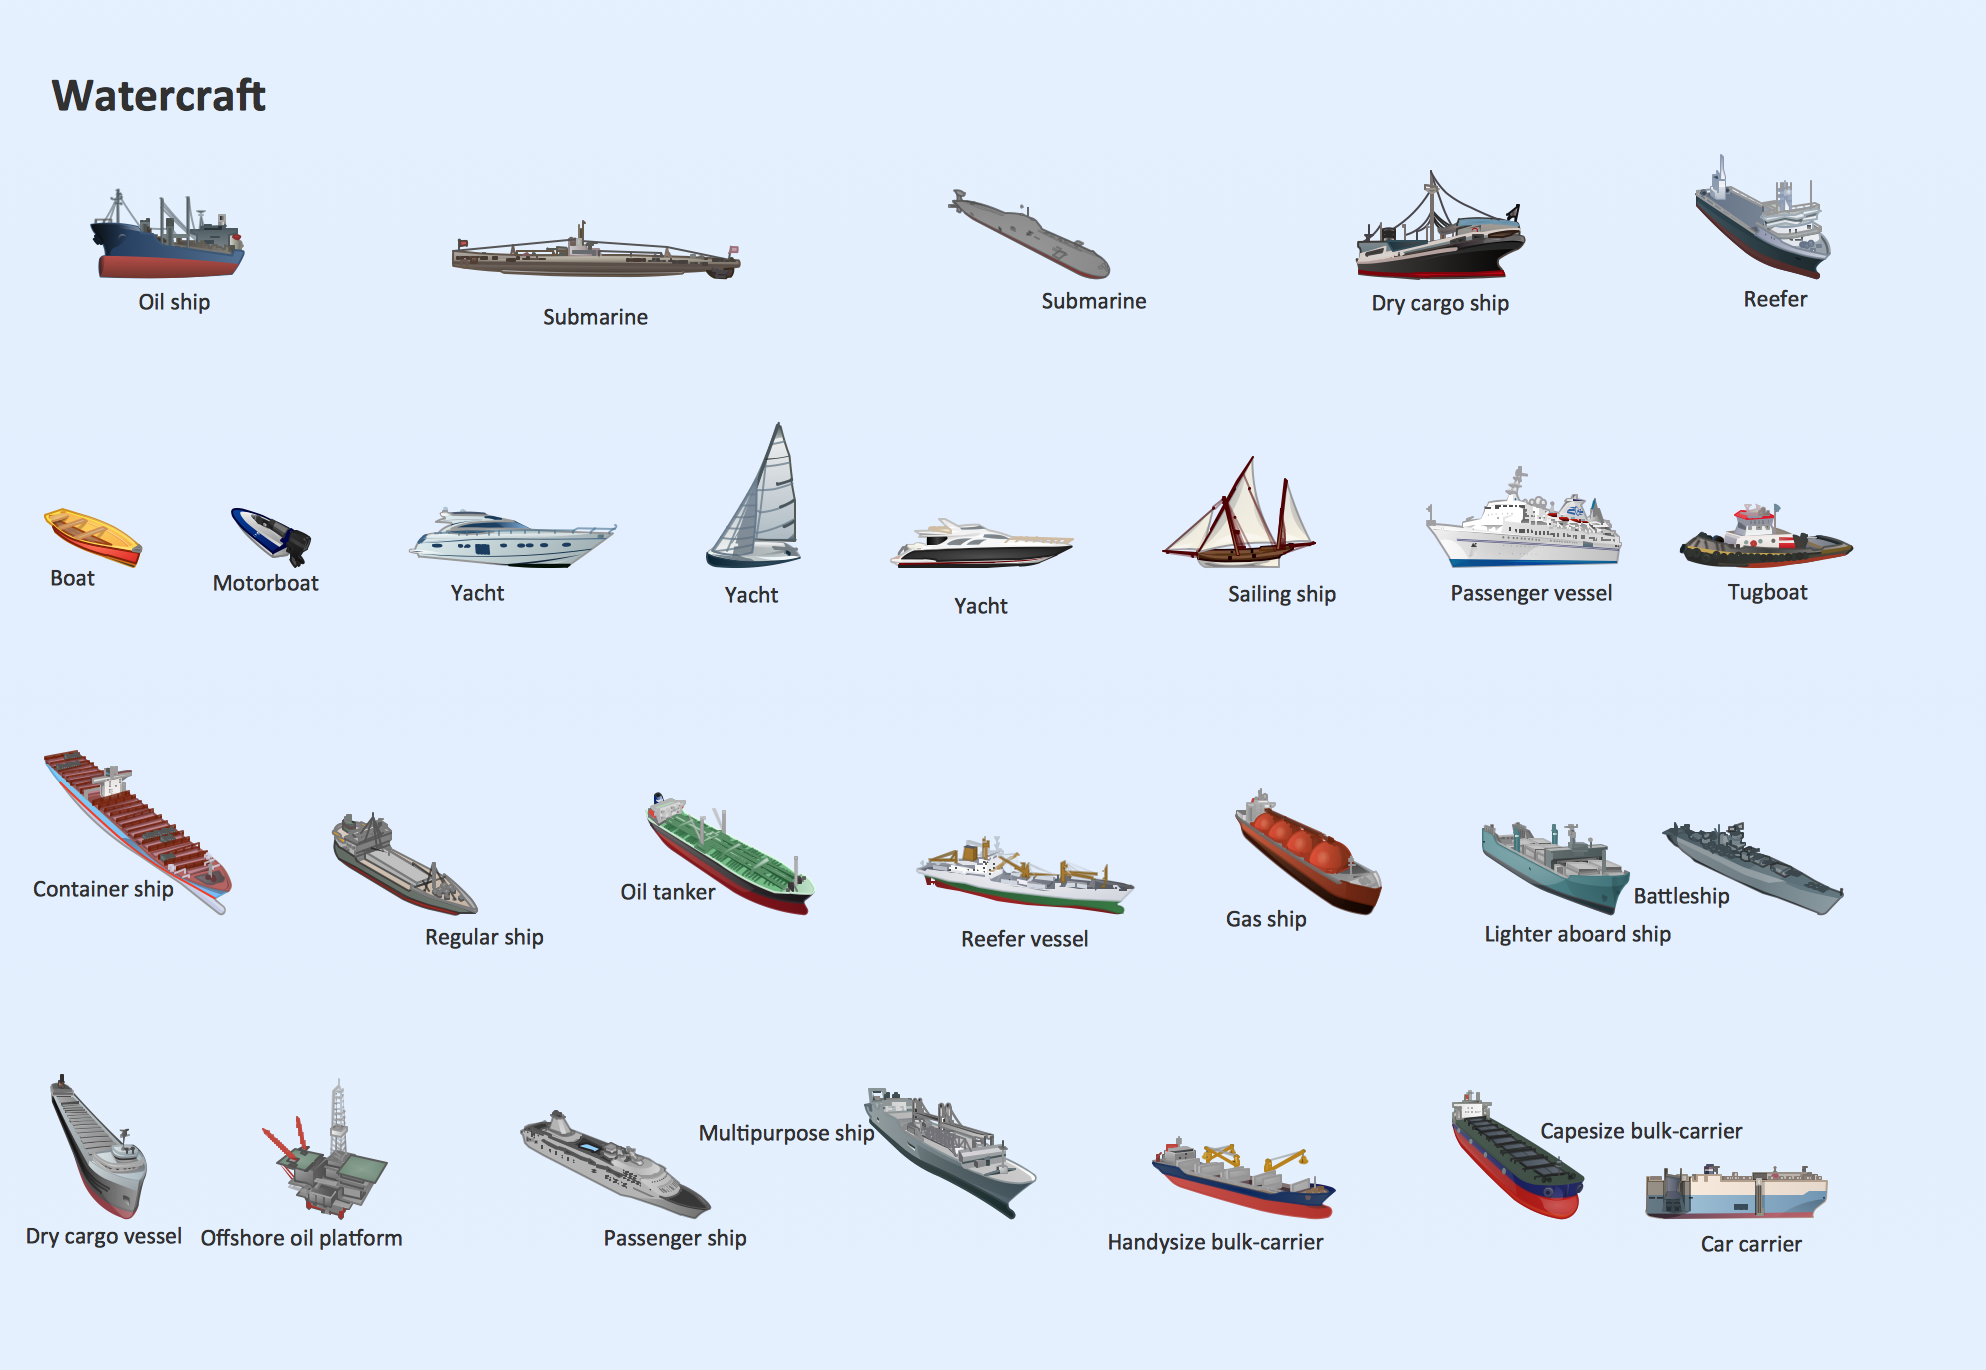
Watercraft - Design Elements
HelpDesk
How to Show the Relationship Between Topics

Relationships Analysis


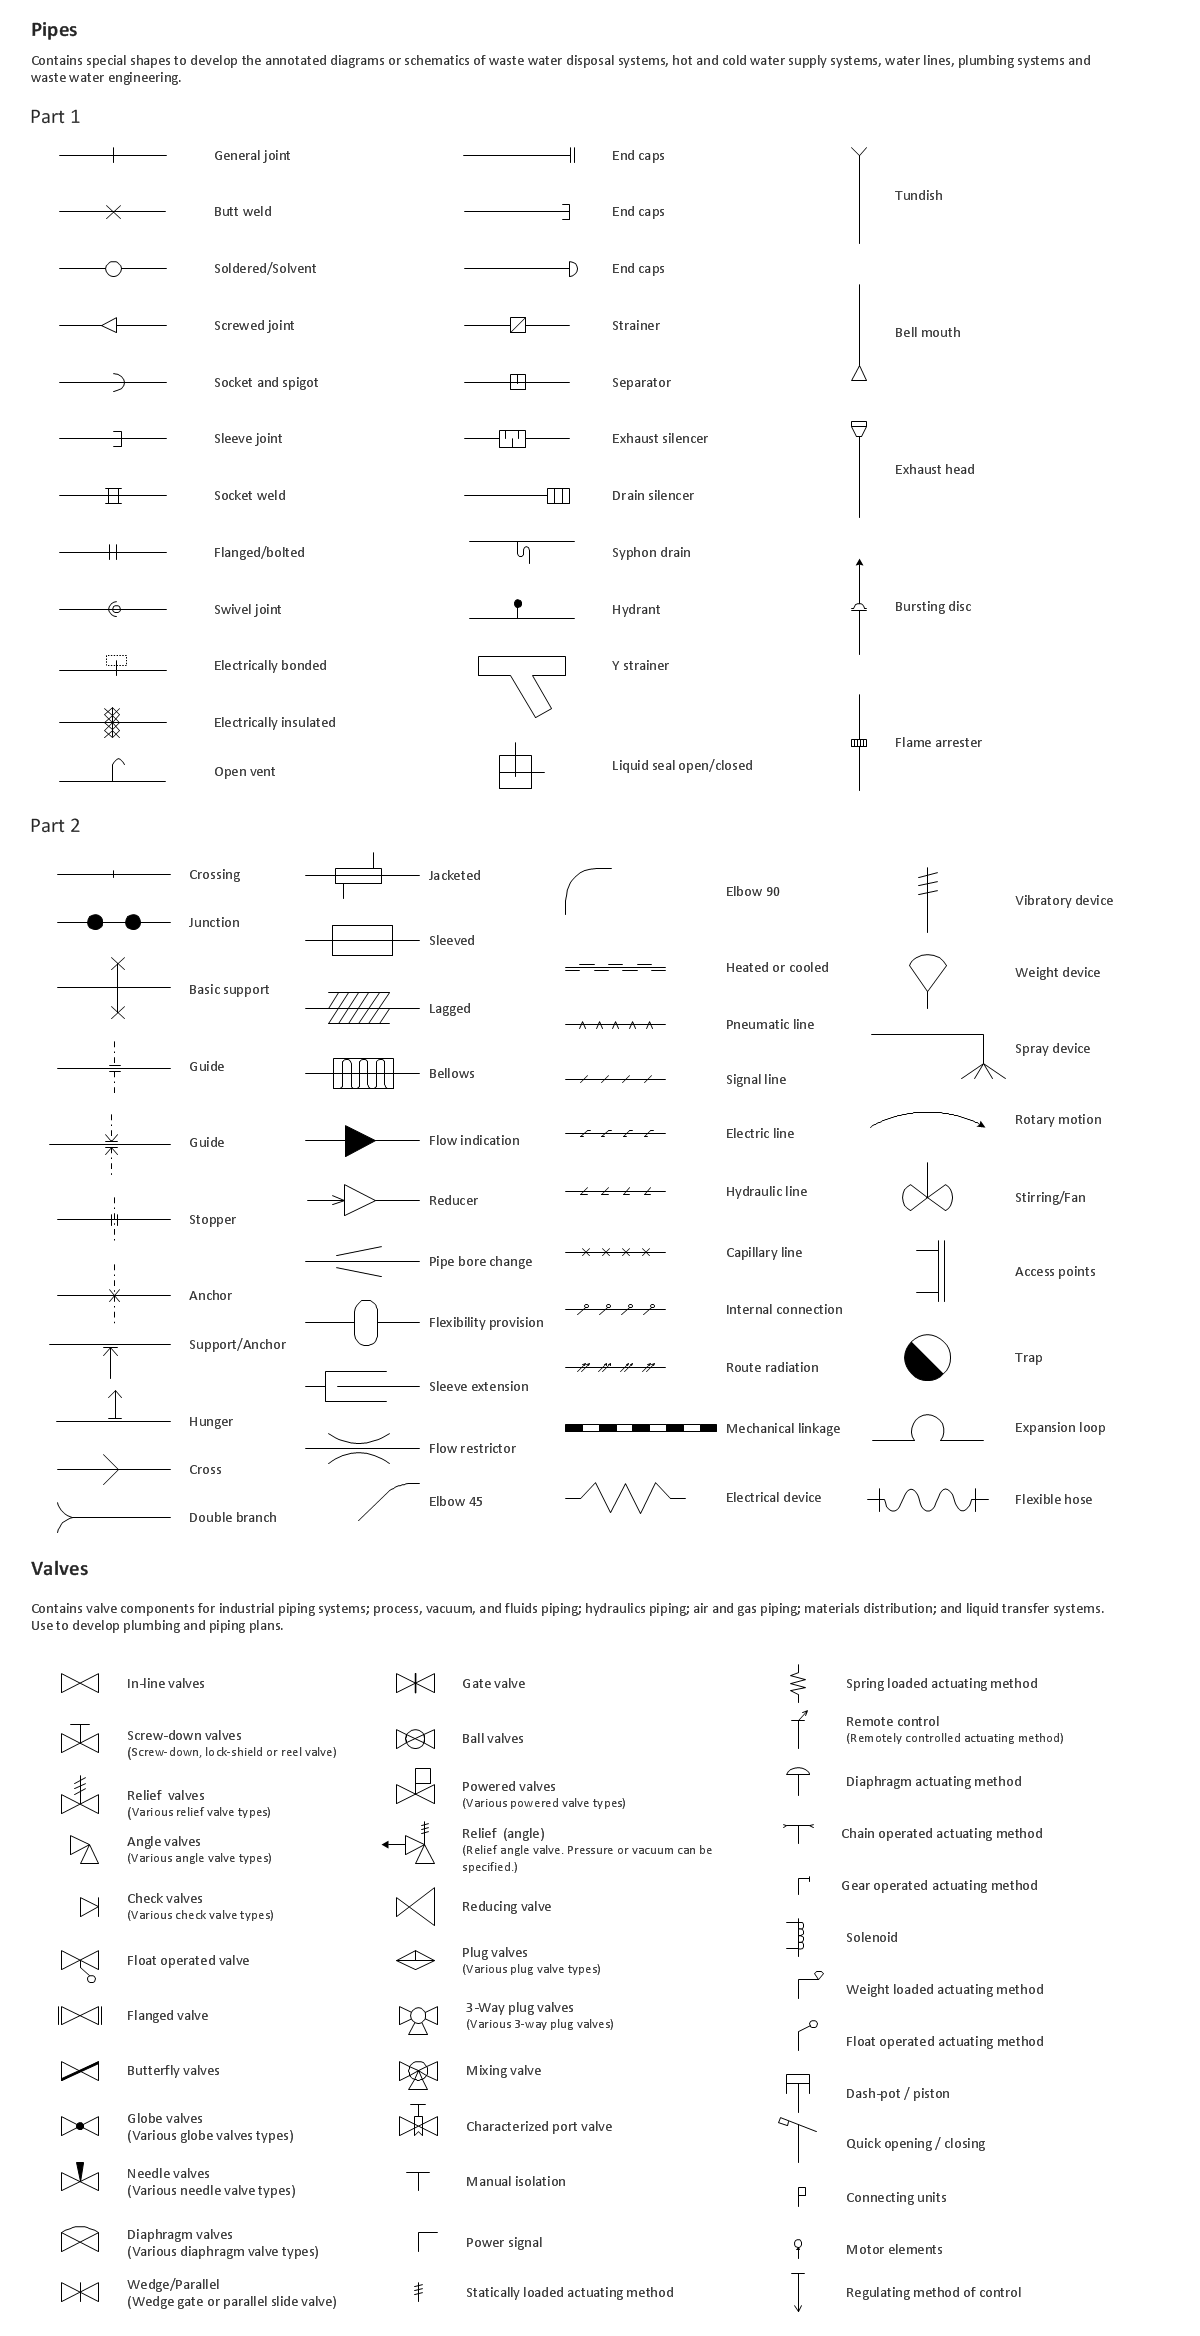
Building Drawing. Design Element: Piping Plan

Road Transport - Design Elements
 Entity-Relationship Diagram (ERD)
Entity-Relationship Diagram (ERD) solution extends ConceptDraw DIAGRAM software with templates, samples and libraries of vector stencils from drawing the ER-diagrams by Chen's and crow’s foot notations.
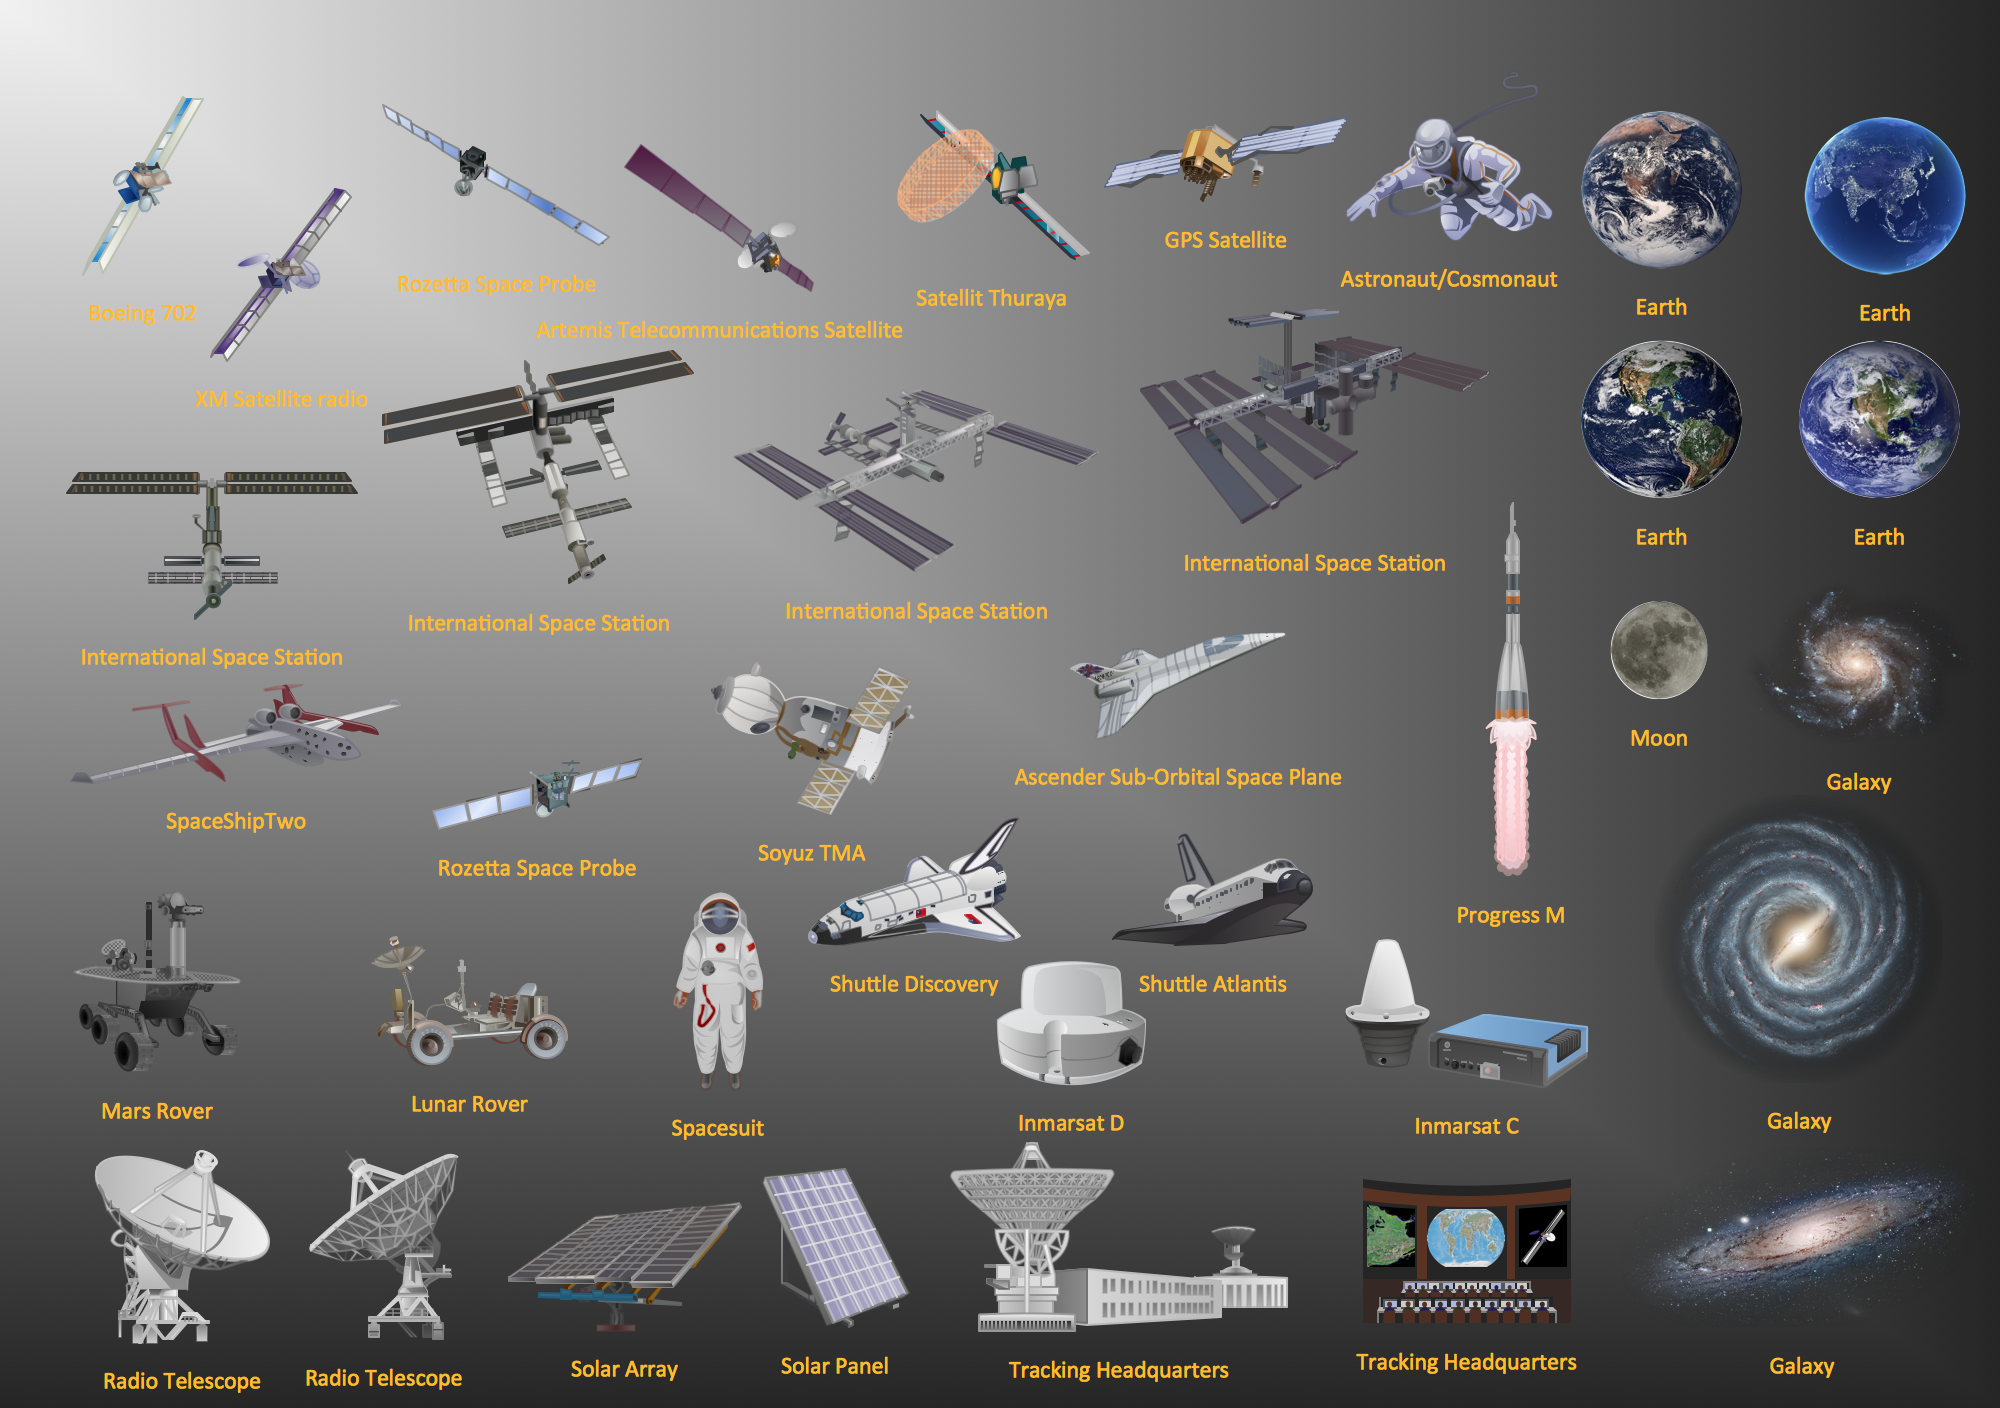
Aerospace - Design Elements
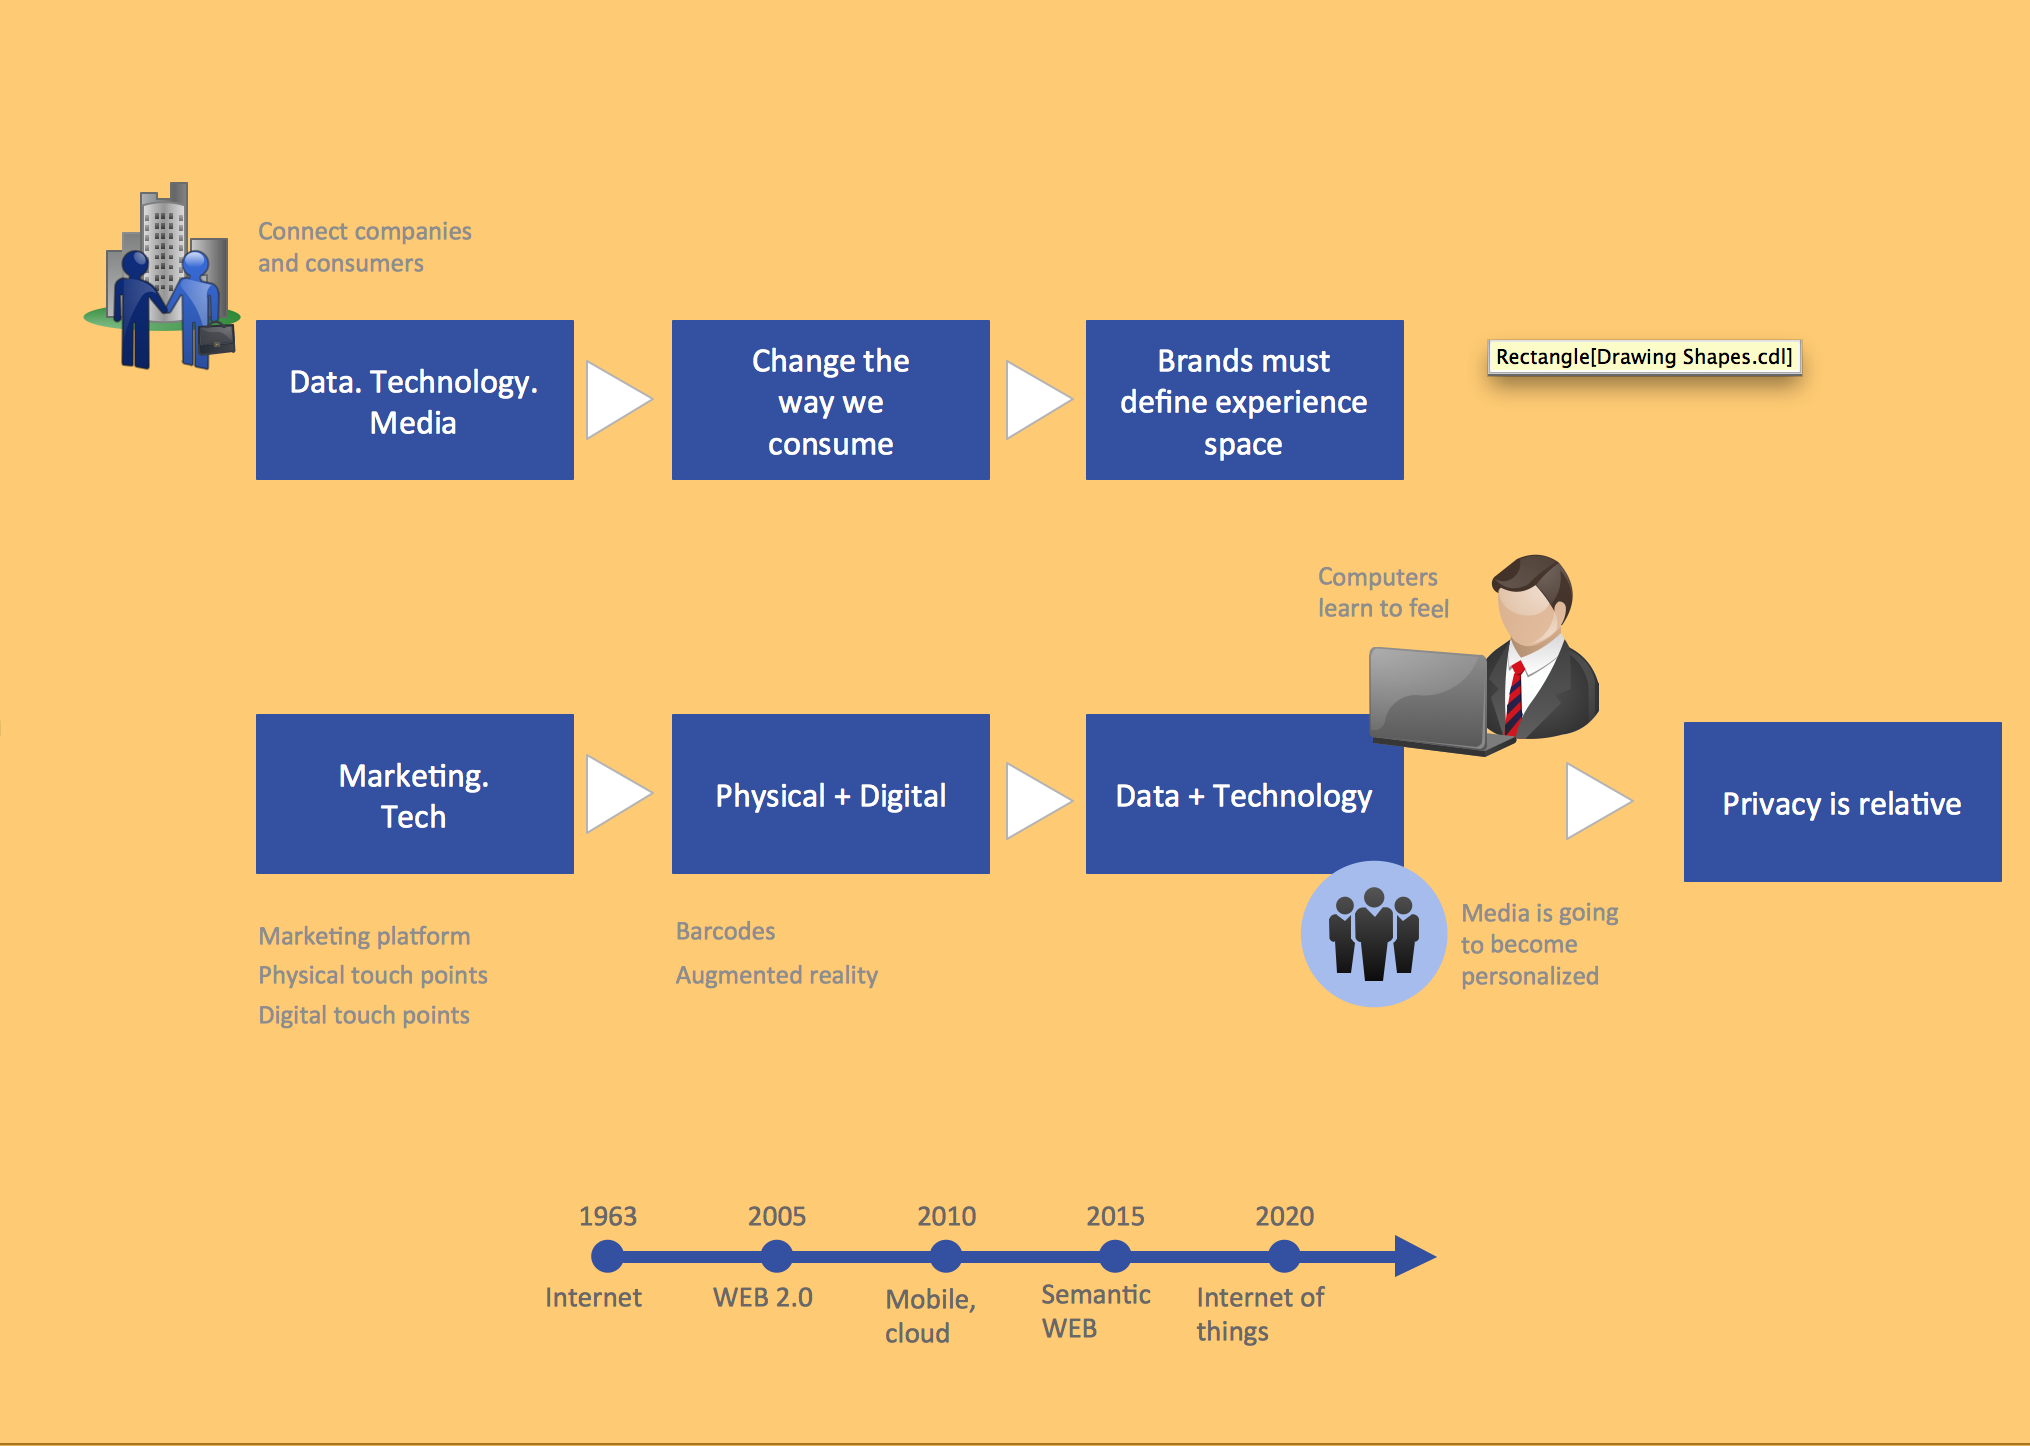
Business and Finance Illustrations
 Aerospace and Transport
This solution extends ConceptDraw DIAGRAM software with templates, samples and library of vector clipart for drawing the Aerospace and Transport Illustrations. It contains clipart of aerospace objects and transportation vehicles, office buildings and anci
This vector stencils library contains 195 cloud computing icons.
Use it to design cloud computing infographic and diagrams with ConceptDraw PRO software.
"Cloud computing, also on-demand computing, is a kind of Internet-based computing that provides shared processing resources and data to computers and other devices on demand. It is a model for enabling ubiquitous, on-demand access to a shared pool of configurable computing resources (e.g., networks, servers, storage, applications and services), which can be rapidly provisioned and released with minimal management effort. Cloud computing and storage solutions provide users and enterprises with various capabilities to store and process their data in third-party data centers.
Cloud computing has become a highly demanded service or utility due to the advantages of high computing power, cheap cost of services, high performance, scalability, accessibility as well as availability." [Cloud computing. Wikipedia]
The vector stencils library "Cloud clipart" is included in the Cloud Computing Diagrams solution from the Computer and Networks area of ConceptDraw Solution Park.
Access point

Airport

Alert

Banknote

Banknote bundle

Banknote bundles

Backup

Bar chart

Big data

Book (closed)
-cloud-clipart---vector-stencils-library.png--diagram-flowchart-example.png)
Book (open)
-cloud-clipart---vector-stencils-library.png--diagram-flowchart-example.png)
Books

Box, close

Box, open

Braces

Brackets

Bug

Building

Bus

Cable connection

Calculator

Calendar

Car

CD/DVD

Check list

Check mark

Clock

Cloud

Cloud computing

Cloud database

Cloud hosting

Cloud storage

Code

Coffee cup

Coin

Coins stack

Coins stacks

Communication

Computer terminal

Console

CPU

Credit card

Cubes

Dashboard

Database

Databases

Datacenter

Dialog box

Dialog boxes

Document

Documents

Dollar sign

Download

Earth

Email

Equal sign

Ethernet jack

Ethernet plug

Euro sign

Exclamation mark

Eye

Feed symbol

Feedback

File

Files

Filter

Firewall

Flash drive

Folder

Folders

Gamepad

Gauge

Gear

Gears, 2

Gears, 3

Globe

Hacker

Hard drive

Heart

Heart rhythm

Home

Hosting

Hotel

House

Image

Info

IP phone

Jet

Key

Keyboard

Laptop

Lego

Letter

Light bulb

Lightning

Line chart

Linux penguin

List

Load balancer

Location mark

Lock, close

Lock, open

Lock and key

Log

Login

Logout

Magnifying glass

Mail

Map

Memory (RAM)
-cloud-clipart---vector-stencils-library.png--diagram-flowchart-example.png)
Microphone

Minus sign

Mobile phone

Monitor

Mouse

Movie

Music

Music player

Network

Network bus

Newspaper

NIC (Network interface controller)
-cloud-clipart---vector-stencils-library.png--diagram-flowchart-example.png)
Not found (Error 404)
-cloud-clipart---vector-stencils-library.png--diagram-flowchart-example.png)
Notebook

Office printer

Operator

Page

Pages

PC

Pencil

Photo

Photo camera

Pie chart

Platform

Plus sign

Pound sign

Printer

Puzzle

Puzzles, 2x2

Puzzles, 3x3

Question sign

Rackmount server

Router

Safe

Satellite

Satellite antenna

Schedule

Sensor

Server

Server rack

Shield

Ship

Shopping bag

Shopping basket

Shopping cart

Sign up

Smartphone

Social network

Software box

Sound

Spider

Spreadsheet

SSD

Star

Stars, 5

Stethoscope

Stickman

Stickmen

Suitcase

Support

Switch

Syringe

Tablet computer

Tools

Train

Truck

Truck 2

TV

Umbrella

Upload

User man

User woman

User profile

Video

Video camera

Video mail

Virtual disk

Virus

Wallet

Web camera

Wifi antenna

Wireless

Wrench

X cross symbol

Yen sign

What is Gantt Chart (historical reference)

This vector stencils library contains 195 cloud computing icons.
Use it to design cloud computing infographic and diagrams with ConceptDraw PRO software.
"Cloud computing, also on-demand computing, is a kind of Internet-based computing that provides shared processing resources and data to computers and other devices on demand. It is a model for enabling ubiquitous, on-demand access to a shared pool of configurable computing resources (e.g., networks, servers, storage, applications and services), which can be rapidly provisioned and released with minimal management effort. Cloud computing and storage solutions provide users and enterprises with various capabilities to store and process their data in third-party data centers.
Cloud computing has become a highly demanded service or utility due to the advantages of high computing power, cheap cost of services, high performance, scalability, accessibility as well as availability." [Cloud computing. Wikipedia]
The vector stencils library "Cloud clipart" is included in the Cloud Computing Diagrams solution from the Computer and Networks area of ConceptDraw Solution Park.
Use it to design cloud computing infographic and diagrams with ConceptDraw PRO software.
"Cloud computing, also on-demand computing, is a kind of Internet-based computing that provides shared processing resources and data to computers and other devices on demand. It is a model for enabling ubiquitous, on-demand access to a shared pool of configurable computing resources (e.g., networks, servers, storage, applications and services), which can be rapidly provisioned and released with minimal management effort. Cloud computing and storage solutions provide users and enterprises with various capabilities to store and process their data in third-party data centers.
Cloud computing has become a highly demanded service or utility due to the advantages of high computing power, cheap cost of services, high performance, scalability, accessibility as well as availability." [Cloud computing. Wikipedia]
The vector stencils library "Cloud clipart" is included in the Cloud Computing Diagrams solution from the Computer and Networks area of ConceptDraw Solution Park.
Access point
Airport
Alert
Banknote
Banknote bundle
Banknote bundles
Backup
Bar chart
Big data
Book (closed)
Book (open)
Books
Box, close
Box, open
Braces
Brackets
Bug
Building
Bus
Cable connection
Calculator
Calendar
Car
CD/DVD
Check list
Check mark
Clock
Cloud
Cloud computing
Cloud database
Cloud hosting
Cloud storage
Code
Coffee cup
Coin
Coins stack
Coins stacks
Communication
Computer terminal
Console
CPU
Credit card
Cubes
Dashboard
Database
Databases
Datacenter
Dialog box
Dialog boxes
Document
Documents
Dollar sign
Download
Earth
Email
Equal sign
Ethernet jack
Ethernet plug
Euro sign
Exclamation mark
Eye
Feed symbol
Feedback
File
Files
Filter
Firewall
Flash drive
Folder
Folders
Gamepad
Gauge
Gear
Gears, 2
Gears, 3
Globe
Hacker
Hard drive
Heart
Heart rhythm
Home
Hosting
Hotel
House
Image
Info
IP phone
Jet
Key
Keyboard
Laptop
Lego
Letter
Light bulb
Lightning
Line chart
Linux penguin
List
Load balancer
Location mark
Lock, close
Lock, open
Lock and key
Log
Login
Logout
Magnifying glass
Mail
Map
Memory (RAM)
Microphone
Minus sign
Mobile phone
Monitor
Mouse
Movie
Music
Music player
Network
Network bus
Newspaper
NIC (Network interface controller)
Not found (Error 404)
Notebook
Office printer
Operator
Page
Pages
PC
Pencil
Photo
Photo camera
Pie chart
Platform
Plus sign
Pound sign
Printer
Puzzle
Puzzles, 2x2
Puzzles, 3x3
Question sign
Rackmount server
Router
Safe
Satellite
Satellite antenna
Schedule
Sensor
Server
Server rack
Shield
Ship
Shopping bag
Shopping basket
Shopping cart
Sign up
Smartphone
Social network
Software box
Sound
Spider
Spreadsheet
SSD
Star
Stars, 5
Stethoscope
Stickman
Stickmen
Suitcase
Support
Switch
Syringe
Tablet computer
Tools
Train
Truck
Truck 2
TV
Umbrella
Upload
User man
User woman
User profile
Video
Video camera
Video mail
Virtual disk
Virus
Wallet
Web camera
Wifi antenna
Wireless
Wrench
X cross symbol
Yen sign
- Basic Flowchart Symbols and Meaning | Value Stream Mapping ...
- Value Stream Mapping Symbols | Entity Relationship Diagram ...
- Value Stream Mapping Symbols
- Symbol In A Ship Signal
- Value stream mapping - Vector stencils library | Design elements ...
- Value Stream Mapping Symbols | Design elements - Value stream ...
- Value Stream Mapping Symbols | Value stream with ConceptDraw ...
- Value Stream Mapping Symbols | Value-Stream Mapping for ...
- Value Stream Mapping Production Control
- Value Stream Mapping Symbols | Lean Manufacturing Diagrams ...
- Value Stream Mapping Symbols | Design elements - Value stream ...
- Symbols Used In Value Stream Mapping
- Value Stream Mapping Production
- Value Stream Mapping Symbols | Learn how to create a current ...
- Value Stream Mapping | Value Stream Mapping Symbols | How to ...
- Value stream mapping - Vector stencils library | Value stream ...
- Rail transport - Design elements | Excellent Examples of Infographic ...
- ERD Symbols and Meanings | ConceptDraw PRO Compatibility with ...
- Process Flowchart | Data Flow Diagram | How to Create Flowcharts ...
- Road Transport - Design Elements | Aerospace - Design Elements ...